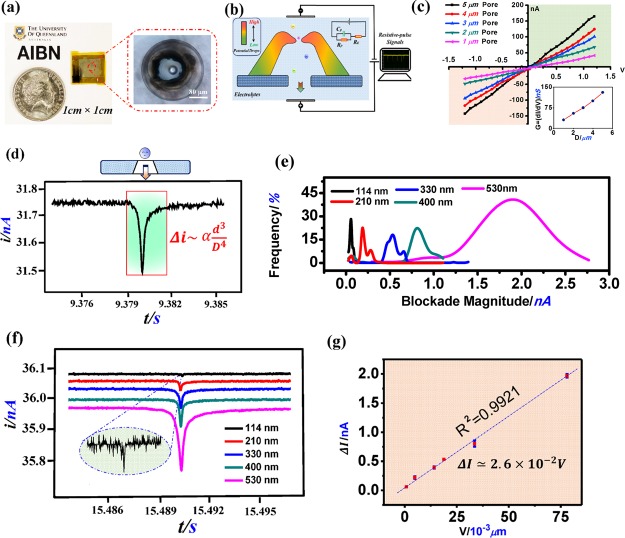
Figure 5.
(a) DLW-TPP-prepared hollow 3D Microcone assembled on the PET substrate (∼1 cm × 1 cm). (b) Schematic graph of the resistive-pulse analysis system using the DLW-TPP-prepared hollow 3D conic microhole structure. A working voltage (Vw) is applied on two sides of the 3D microdevice. (c) i–v curves of hollow 3D microstructures integrated with different-sized circular openings, ranging from 1 to 5 μm. Working voltage range: −1.2 to 1.2 V, voltage step: 0.06 V. The down-right inset figure: The conductivity of the resistive-pulse characterization system vs opening size of the hollow 3D microhole devices. (d) Single current blockade induced by 300 nm PS nanoparticles passing through the hollow 3D microdevice with a 3 μm-sized circular opening hole. Vw: 0.3 V. (e) Current blockade magnitude (Δi) distribution of different types of PS nanoparticles (i.e., 114, 210, 300, 400, and 530 nm) characterized using the hollow 3D Microcone structure with a 3 μm-sized circular opening hole design. Vw: 0.3 V. (f) Combined single current blockade of different types of PS nanoparticles (114–530 nm) passing through a hollow 3D Microcone structure with a 3 μm-sized circular opening design. Vw: 0.3 V. Each individual signal was normalized to the same (current/time) scale. (g) Relationship of current blockade magnitude vs nanoparticle volume size in resistive-pulse analysis using the hollow 3D Microcone structure with a 3 μm-sized circular opening hole. Vw: 0.3 V.

