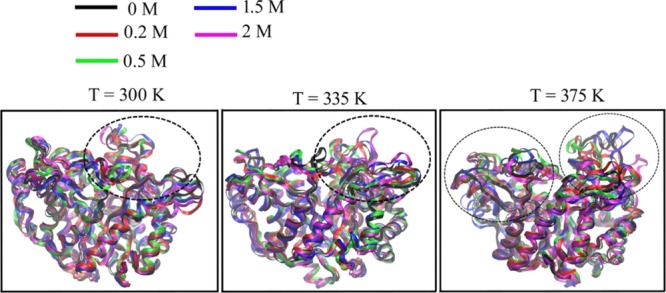
Figure 3.

Alignment of the backbone Cα atoms of the last configuration of the enzyme after simulation in different glucose concentrations at T = 300, 335, and 375 K. The black dotted circles in the figure indicate the region (324, 325, 410, and 411 in the gatekeeper region and residue 415 at the glycone-binding site) where structural changes occur in the presence of glucose.
