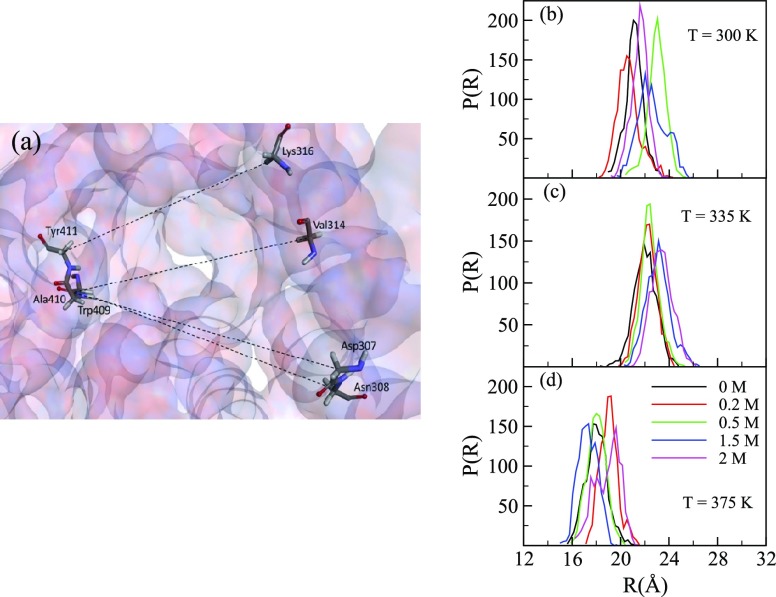
Figure 8.
(a) Top view of the B8CYA8 active site tunnel entrance gate with Tyr409, Ala410, Tyr41, Lys316, Val314, Asp307, and Asn308 highlighted in sticks. Oxygen, nitrogen, and carbon atoms are represented by red, blue, and green colors, respectively. The average distance distributions [P(R)] across these residues were measured at T = (b) 300, (c) 335, and (d) 375 K, respectively, for different glucose concentrations.

