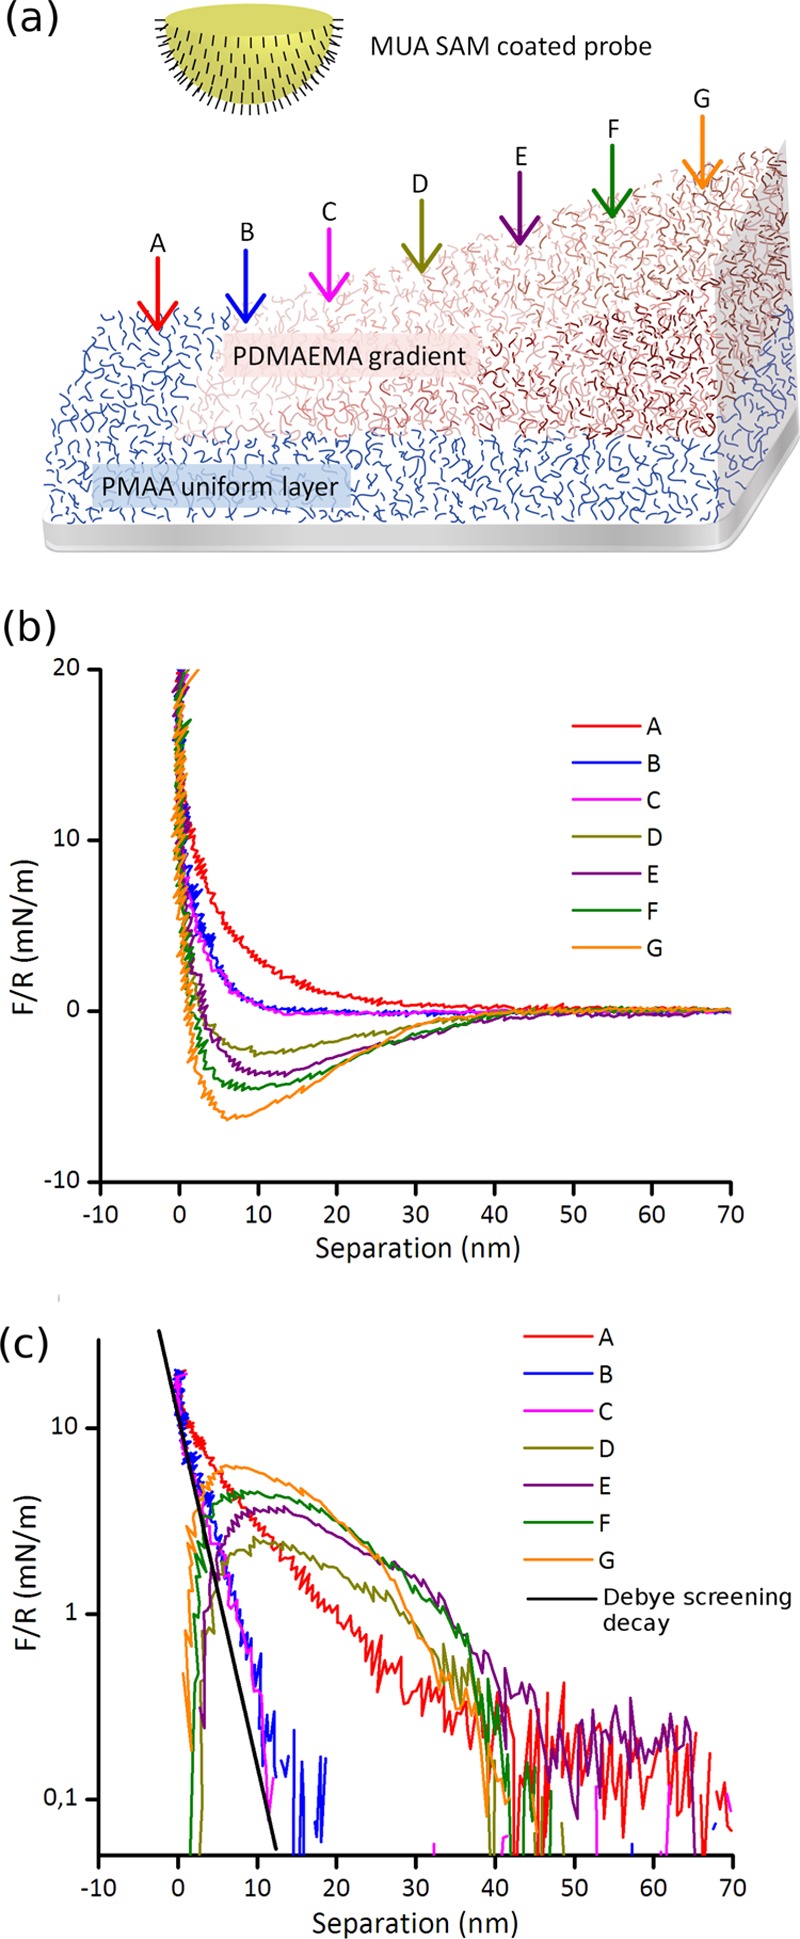
Figure 3.

(a) Cartoon showing the geometry of the experiment (not to scale; note that in reality, some degree of interpenetration of the two polymer layers occurs). The P(MAA–DAMEMA) gradient is probed by an MUA self-assembled monolayer (SAM)-coated probe and arrows indicate the positions of the obtained force curves at 500 μm intervals. Position A is bare PMAA and the PDMAEMA gradient starts from curve B, increasing in thickness toward G. (b) Force curves on a P(MAA–DMAEMA) gradient, obtained in 10 mM PB buffer at pH 6.0, upon approach. (c) shows the same data as in (b), plotted on a log scale (curves D–G with an opposite sign). Solid black line in (c) is the decay of the electrostatic repulsion for the used buffer ionic strength, adjusted to coincide with curves B and C at short separation.
