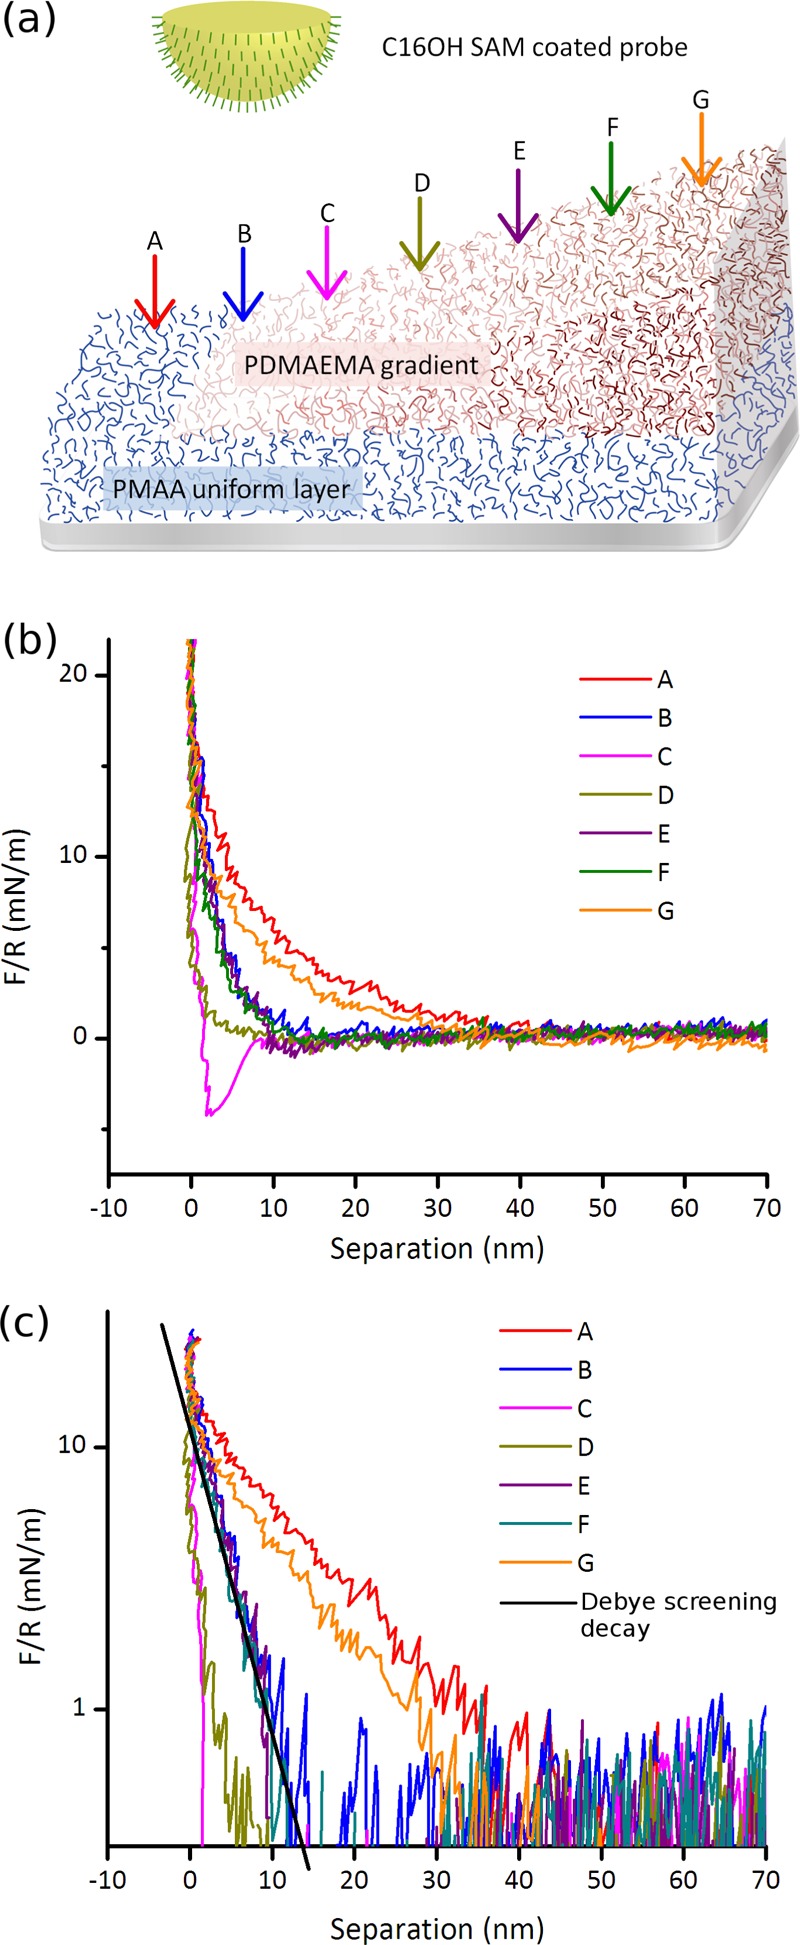
Figure 4.

(a) Experimental geometry. P(MAA–DAMEMA) gradient is probed by a C16OH SAM-coated probe and the arrows indicate the positions where the force curves were obtained. Position A is bare PMAA, and the PDMAEMA gradient starts from curve B, increasing in thickness toward G. (b) Force curves obtained in 10 mM PB buffer at pH 6.0, and (c) the same data plotted on a log scale, and the solid line in (c) is the exponential decay obtained from the Debye length of the buffer, adjusted to coincide with curves B, E, and F at short separations.
