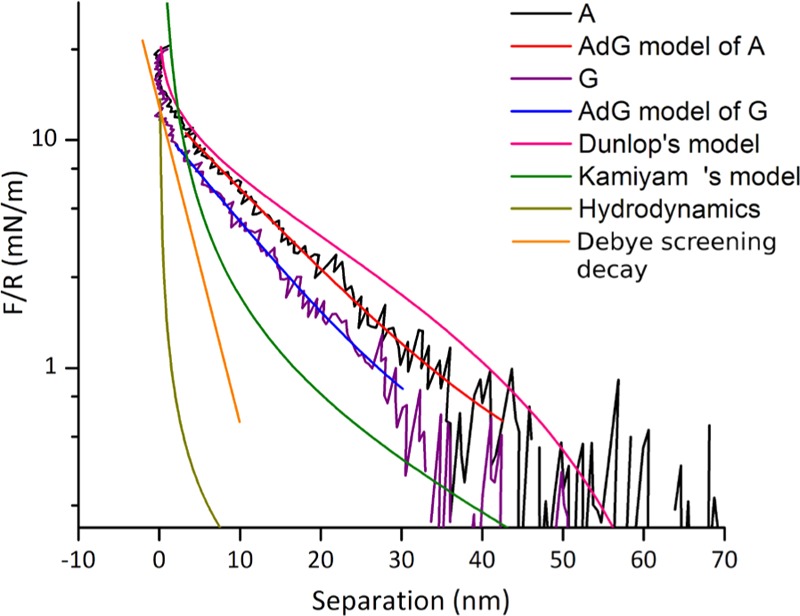
Figure 5.

Force curves A and G of P(MAA–DMAEMA) gradient are probed by a C16OH-SAM-modified probe, which fitted by single exponential decay curves (red and blue) according to the Alexander–de Gennes model. Pink curve is Dunlop’s model and the green curve is Kamiyama’s model. Both the expected electrostatic contributions determined by the Debye length (orange) and the hydrodynamic force at the used approach rate (dark yellow) are considerably smaller than the measured forces.
