Figure 8.

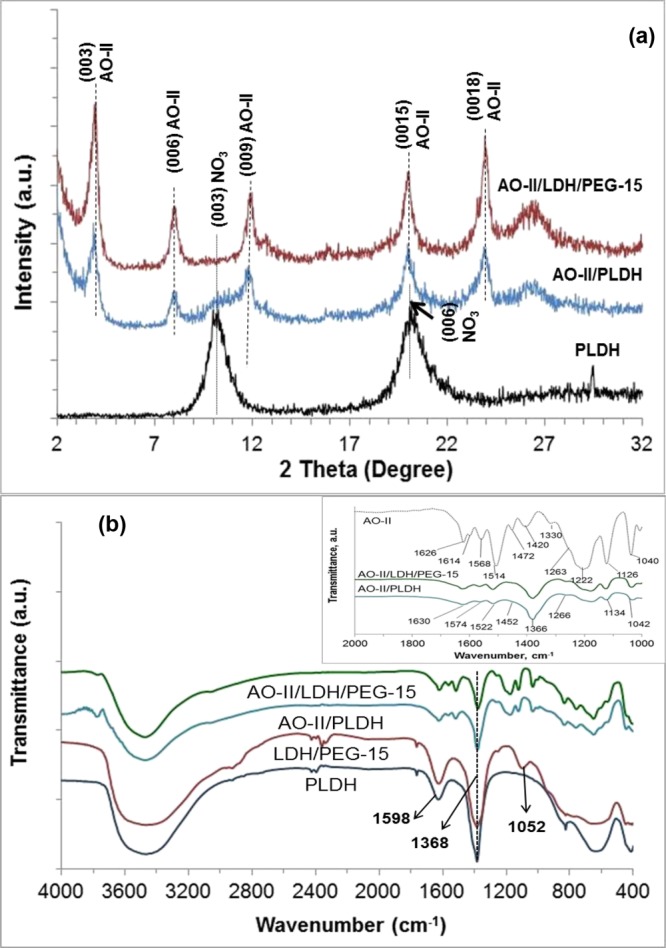
(a) XRD patterns of the AO-II-loaded adsorbents and (b) FTIR spectra of the adsorbents before and after adsorption. The inset of figure (b) shows the amplified FTIR spectrum between 1000 and 2000 cm–1.

(a) XRD patterns of the AO-II-loaded adsorbents and (b) FTIR spectra of the adsorbents before and after adsorption. The inset of figure (b) shows the amplified FTIR spectrum between 1000 and 2000 cm–1.