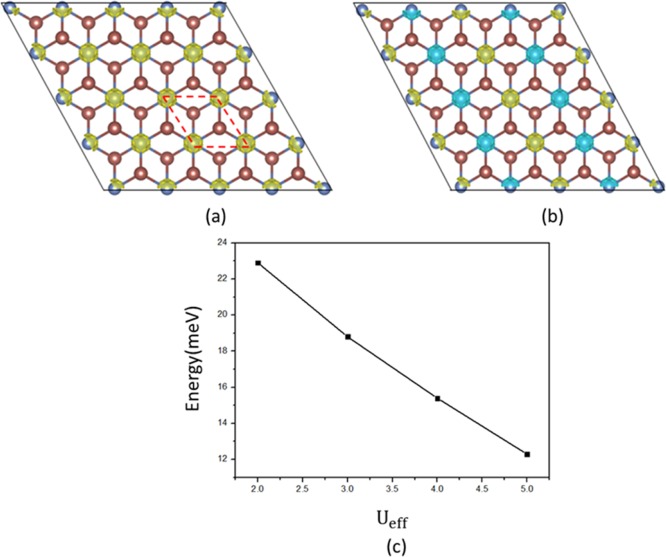
Figure 2.
Spin density (isovalue of 0.025 e/Å3) of (a) the FM state and (b) AFM state. Yellow and blue isosurfaces represent net spin-up and spin-down charge densities, respectively. The rhombic primitive cell is marked by a red dotted line. (c) Change of exchange energy of monolayer NiI2 with respect to different values of Ueff.

