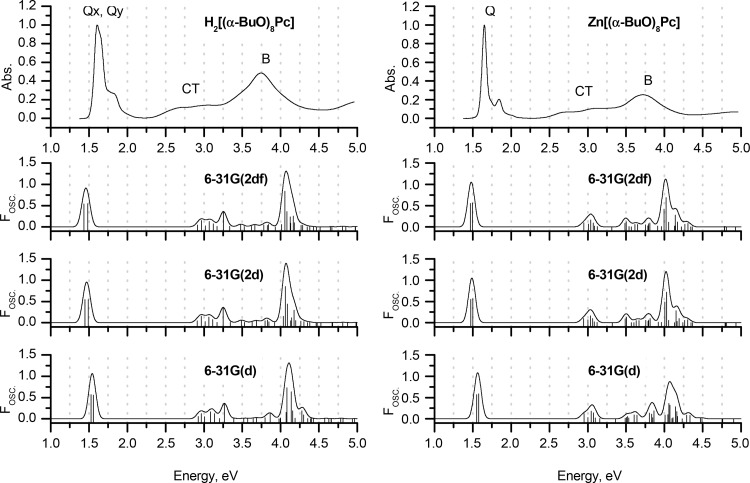
Figure 13.
Experimental UV–vis spectra of H2[(α-BuO)8Pc] and Zn[(α-BuO)8Pc] in chloroform (TOP) and the sTD-DFT calculated spectra of H2[(α-MeO)8Pc] and Zn[(α-MeO)8Pc] calculated by using the CAM-B3LYP functional with various double-ζ basis sets. The geometries of the complexes were optimized in the gas phase at the BP86/def2-SVP level of theory. The bandwidths in the simulated spectra were set to 0.05 eV.

