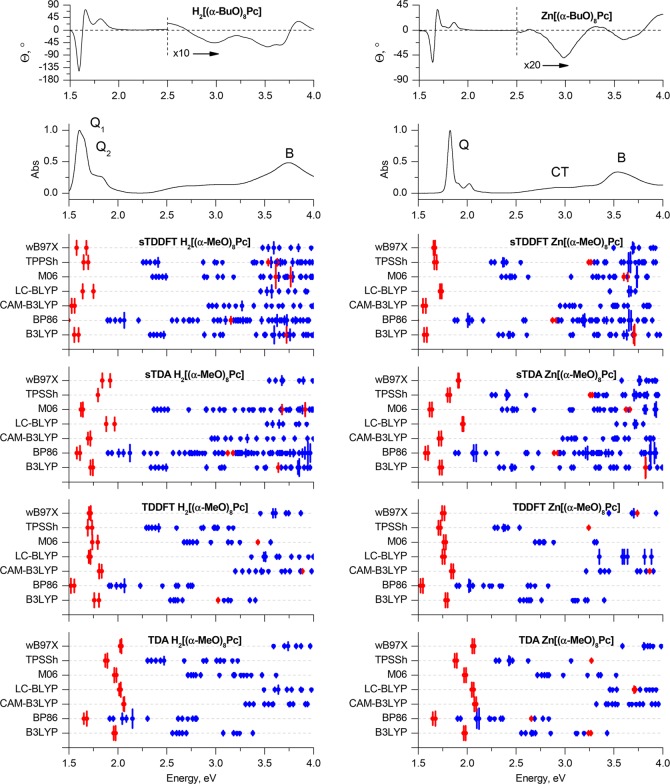
Figure 6.
Experimental MCD and UV–vis spectra of H2[(α-BuO)8Pc] and Zn[(α-BuO)8Pc] in chloroform (TOP) are plotted on an energy scale to provide a comparison with the positions of the vertical transitions calculated in gas phase for the H2[(α-MeO)8Pc]Pc and Zn[(α-MeO)8Pc] model complexes optimized in gas phase at the BP86/def2-SVP+D3BJ level of theory. The size of the vertical lines is proportional to the oscillator strengths of the corresponding transitions. For clarity, only transitions with Fosc. > 0.005 are shown. Red is used to highlight the Q- and B-bands that are associated with excitations predominantly involving the a, s, –a, and –s of Michl’s perimeter model. Blue lines show transitions predominantly involving non-Michl’s orbitals.

