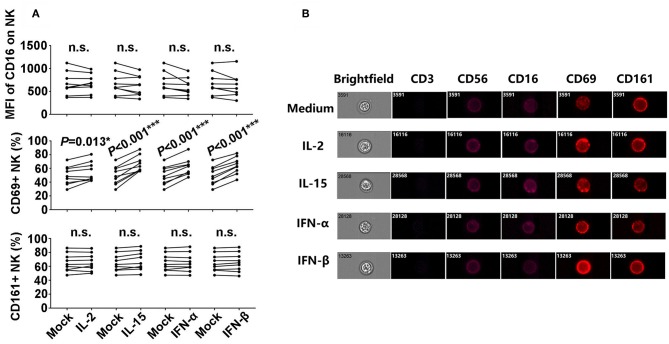
Figure 2.
Phenotypic characteristics of NK cells after incubation with L-2, IL-15, IFN-α, and IFN-β. (A) Comparison of CD16, CD69, and CD161 expressions on NK cells from the healthy donors after incubation with IL-2, IL-15, IFN-α, and IFN-β (50 ng/ml, 12 h), respectively (n = 8). (B) Images of CD3, CD56, CD16, CD69, and CD161 expressions on CD56dim NK cells at single-cell level after incubation with IL-2, IL-15, IFN-α, and IFN-β (50 ng/ml, 12 h), respectively. Data is acquired in an ImageStream x Mark II system. All P-values are two-tailed and significantly different with P < 0.05.

