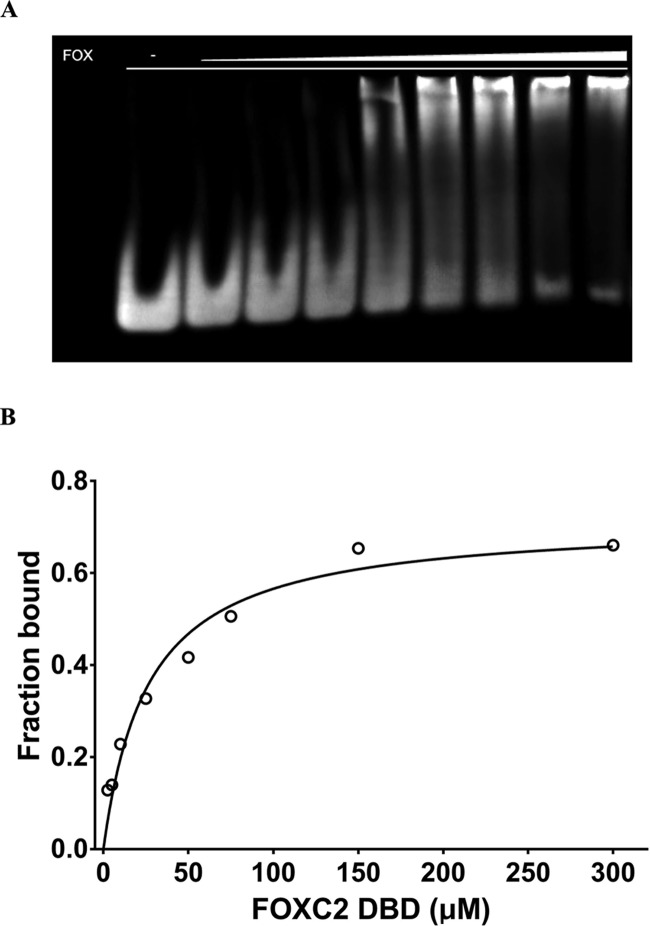
Figure 3.
Electrophoretic mobility shift assay of FOXC2 and DNA. (A) FOXC2 and DNA binding by EMSA. The purified FOXC2 DBD was mixed with the DNA containing TAAACA motif, and the protein–DNA complexes were separated on a 6% acrylamide gel. Increasing concentrations of FOXC2 DBD, 0, 2.5, 5, 10, 25, 50, 75, 150, and 300 μM, were used (lanes 1–9). (B) Linear scale saturation binding curve of FOXC2 DBD measured by EMSA. The Kd and R2 were estimated as 26.4 ± 3.9 μM (95% CI: 18.7–37 μM) and 0.94, respectively. The error bar indicates a standard deviation of measurements from triplicate experiments.

