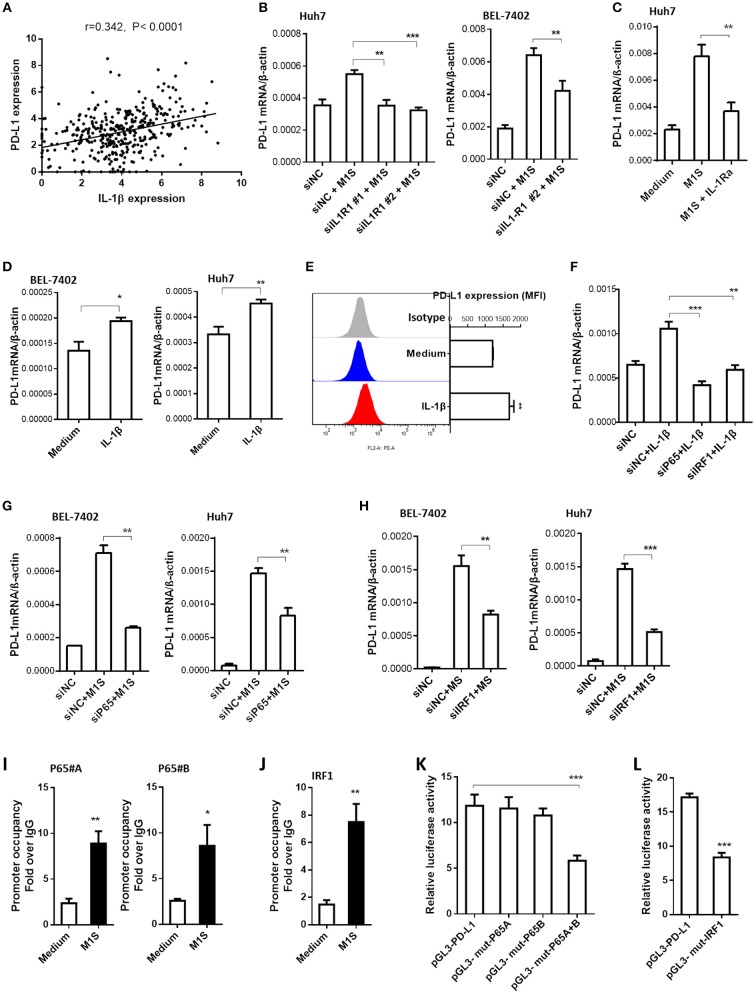
Figure 5.
IL-1β signaling was responsible for PD-L1 expression in HCC cells induced by M1 macrophages. (A) Co-expression of IL-1β and PD-L1 gene in HCC samples from TCGA database. (B) HCC cells were transfected with siNC or siIL-1R1, then cultured in the presence or absence of M1S. The PD-L1 expression in these HCC cells was determined by quantitative RT-PCR assay. (C) Huh7 cells pretreated with IL-1Ra were cultured in the presence or absence of M1S. The PD-L1 expression was detected by quantitative RT-PCR. (D) HCC (BEL-7402 or Huh7) cells were stimulated with IL-1β. The PD-L1 expression was detected by quantitative RT-PCR. (E) Huh7 cells were stimulated with IL-1β. The PD-L1 expression was detected by flow cytometry. (F) Huh7 cells were transfected with siNC, siP65, or siIRF1, then cultured in the presence or absence of IL-1β. The PD-L1 expression was determined by quantitative RT-PCR assay. (G,H) HCC cells were transfected with siNC, siP65, or siIRF1, then cultured in the presence or absence of M1S. The PD-L1 expression was determined by quantitative RT-PCR assay. (I,J) BEL-7402 cells were treated with or without M1S, then, CHIP assay was performed to assess the occupancy of transcription factor P65 or IRF1 on the PD-L1 promoter. (K,L) BEL-7402 cells were co-transfected with the mixture of internal control plasmid pRL-TK and luciferase reporter plasmid pGL3-PD-L1, pGL3-mut-p65A, pGL3-mut-p65B, pGL3-mut-p65A+B, or pGL3-mut-IRF1, then treated with M1S. The relative luciferase activities were measured by dual-luciferase reporter assay. The experiment was carried out in triplicate and repeated at least twice. Data are shown as means ± SD. *P < 0.05, **P < 0.01, ***P < 0.001.

