
Figure 3.
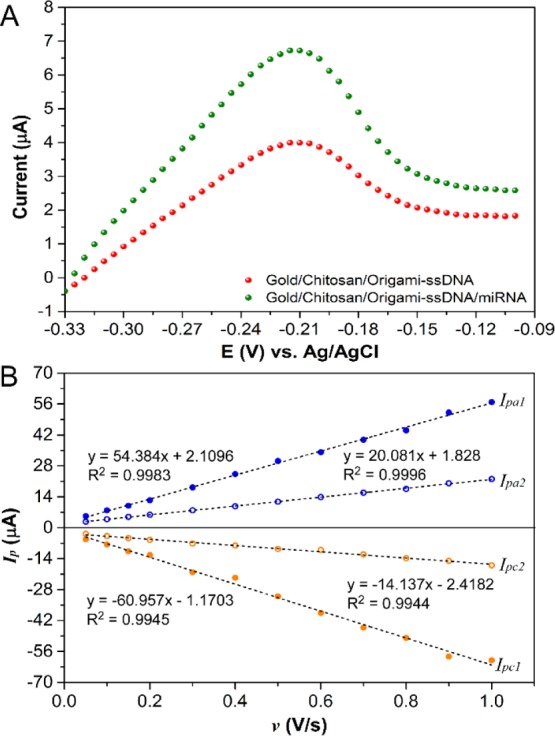
Representative LSV curves, recorded in 1× PBS buffer containing 0.1 M KCl for ssDNA probes (red curve) and miRNA/ssDNA probes (green curve), after incubation with 4 μM MB solution for 5 min (A), dependence of the MB redox peak current on v for ssDNA and miRNA/ssDNA (B). Ipa1 and Ipc1 are for gold/chitosan/origami-ssDNA/miRNA and Ipa2 and Ipc2 are for gold/chitosan/origami-ssDNA.