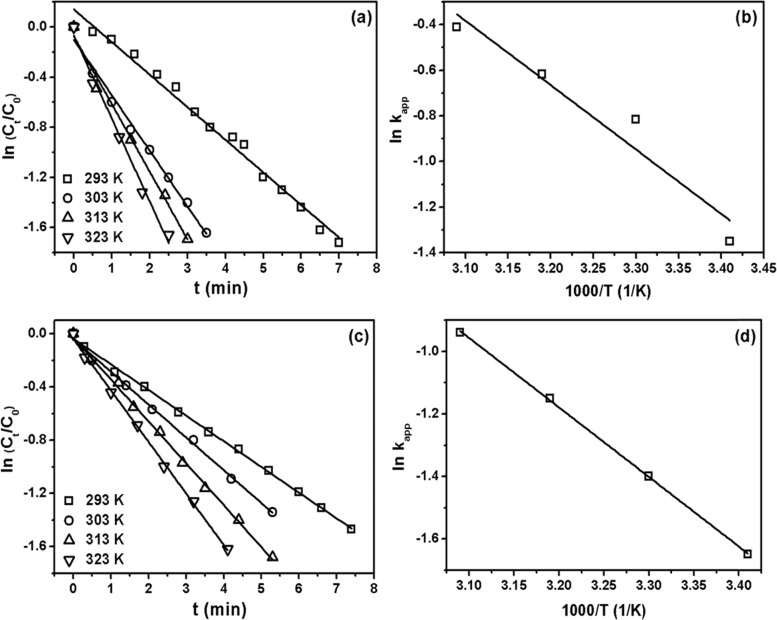
Figure 7.
Fe3O4@SiO2-NH2–Au catalyst reactivity results: (a, c) relationships between ln(Ct/C0) and reaction time (t) at four different temperatures for 4-NP and 2-NA, respectively; (b, d) plots of ln kapp versus 1/T for 4-NP and 2-NA, respectively. The black lines correspond to the best straight line fit.

