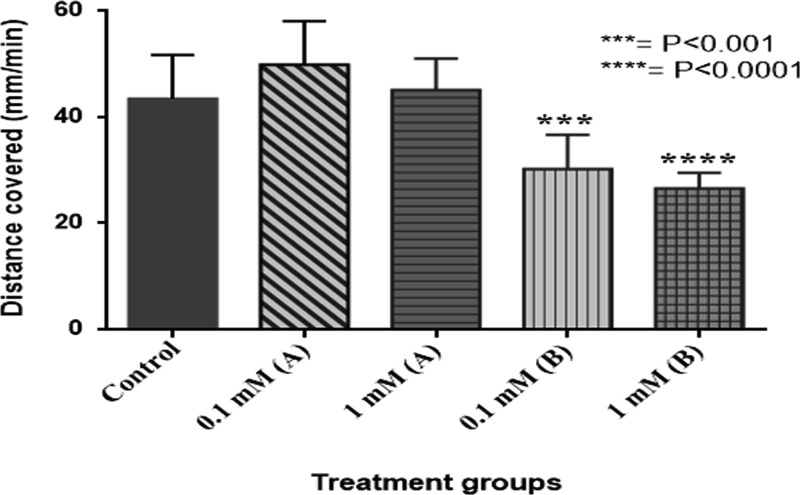
Figure 12.
Distance covered by larvae that fed on control, (A) positively charged CeO2 NPs, and (B) negatively charged CeO2 NP-containing food. The values represented are mean ± SEM (n = 9). Statistical significance was set to P < 0.05, and significant values indicate a decrease in distance covered by larvae when compared to control.

