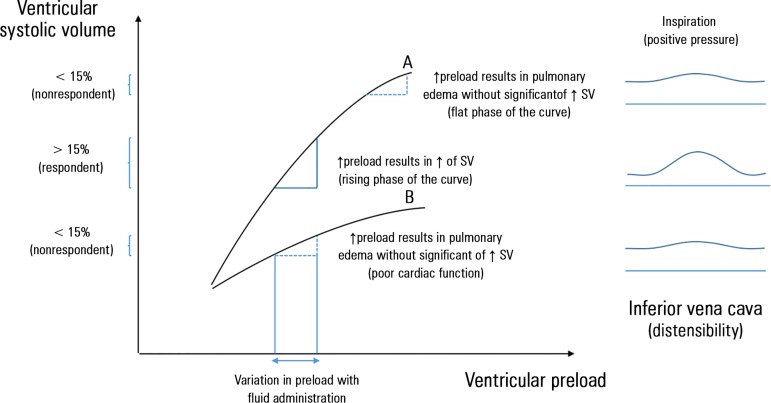
Figure 1.
Frank-Starling curve and its relationship with inferior vena cava variation among patients under invasive mechanical ventilation.
The relationship between preload and systolic volume: Frank-Starling curve. This figure shows the expected increase in systolic volume after the administration of fluids, which depends on cardiac function and the initial preload. For the same amount of fluids administered and for a similar initial preload, the variation in the resulting systolic volume depends on the cardiac function: (A) The Frank-Starling curve of a patient with normal cardiac function. In patients with normal cardiac function, the results of fluid administration only depend on the initial preload: If it is low (rising phase of the curve), then systolic volume significantly increases (≥ 10 - 15%, respondent patient), corresponding to a significant variation in the diameter of the inferior vena cava with the application of positive pressure to the thorax during inspiration in the ventilated patient; if it is elevated (flat phase of the curve), then no significant increase in systolic volume is observed (<10 - 15%, nonrespondent) leading to pulmonary overload, which corresponds to an inferior vena cava with little distension. (B) The Frank-Starling curve in a patient with decreased cardiac function. In this case, the administration of fluids, even with low initial preload, may result in pulmonary fluid overload without a significant increase in systolic volume. SV - systolic volume

