Figure 2.

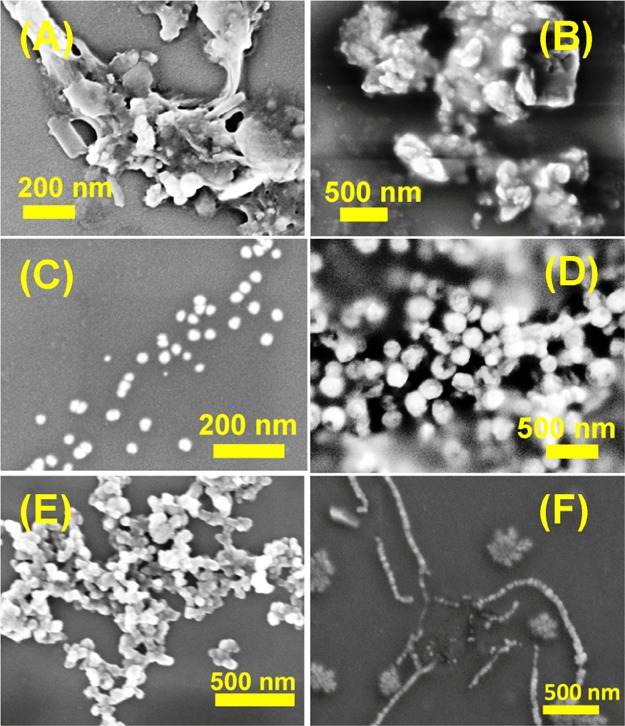
SEM images of NP (A) NP1 (H-Phe-Phe-gly-A-aeg-NH2), (B) NP2 (H-Phe-Phe-gly-C-aeg-NH2), (C) NP3 (H-Phe-Phe-gly-G-aeg-NH2), (D) NP4 (H-Phe-Phe-gly-T-aeg-NH2), (E) 1:1 mixture of NP1 and NP4, and (F) 1:1 mixture of NP2 and NP3.

SEM images of NP (A) NP1 (H-Phe-Phe-gly-A-aeg-NH2), (B) NP2 (H-Phe-Phe-gly-C-aeg-NH2), (C) NP3 (H-Phe-Phe-gly-G-aeg-NH2), (D) NP4 (H-Phe-Phe-gly-T-aeg-NH2), (E) 1:1 mixture of NP1 and NP4, and (F) 1:1 mixture of NP2 and NP3.