Figure.
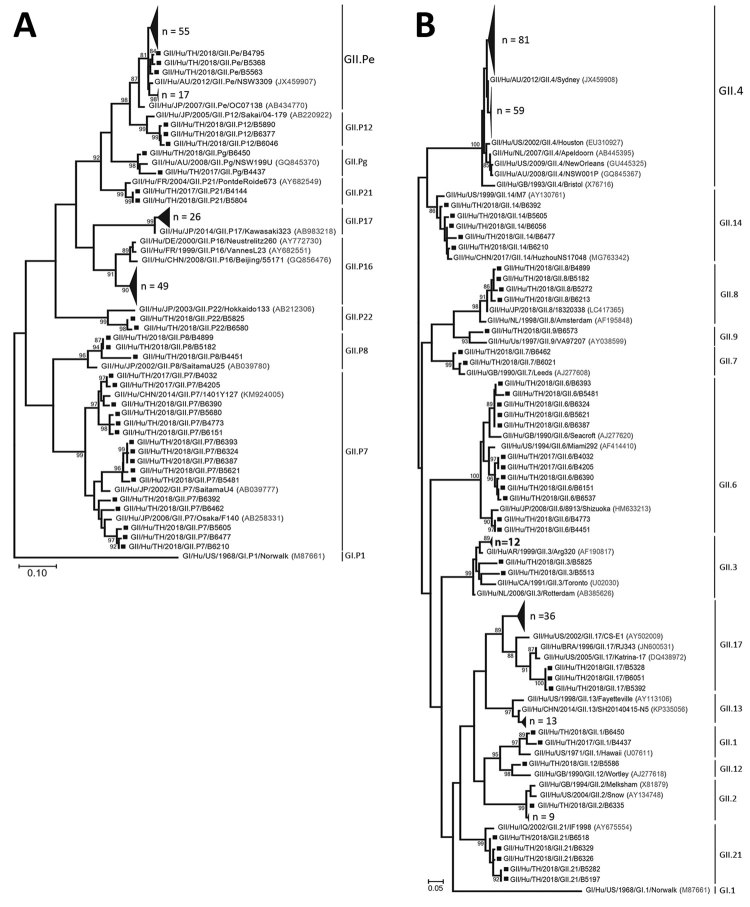
Phylogenetic trees of the norovirus GII partial-nucleotide sequences. A) Analysis of the RNA-dependent RNA polymerase (RdRp) region (380 bp). B) Analysis of the major capsid protein VP1 region (271 bp). Trees were generated by using the maximum-likelihood method with 1,000 bootstrap replicates implemented in MEGA7 (https://www.megasoftware.net). Bootstrap values >80 are indicated at the nodes. Strains of sufficient nucleotide sequence length were included in the trees (denoted individually with squares and in groups with large triangles). Reference strains are shown with accession numbers (in parentheses). Scale bars indicate nucleotide substitutions per site.

