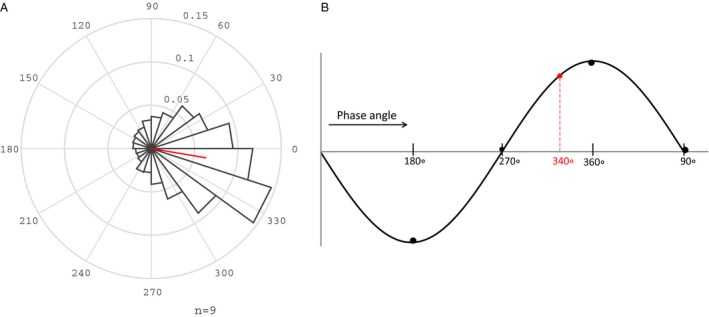
Figure 2.

Phase targeting of acoustic pulses to the up‐state of the slow wave. (A) Distribution of phase for all acoustic pulses. Spread is depicted in 20 bins of 18°. Red line indicates mean phase vector. (B) Schematic of targeted phase angle (dotted red line) 20° prior to the peak of the up‐state (360/0°).
