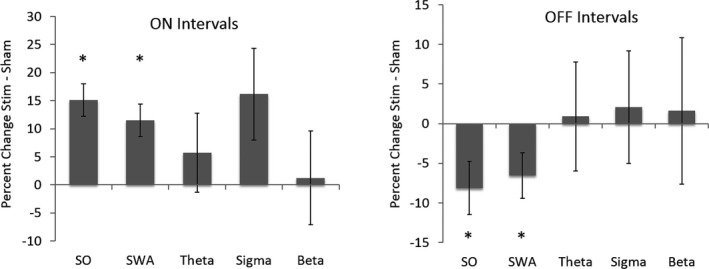
Figure 4.

Percentage change in spectral power for SO (>0.5–1 Hz), SWA (>0.5–4 Hz), θ (>4–8 Hz), σ (>9–15 Hz), and β (>16–25 Hz) for stim and sham ON and OFF intervals. (A) SO and SWA power was significantly increased in stim ON compared to sham ON conditions, with a trend for σ power (SO: P = 0.001, SWA: P = 0.003, σ: P = 0.09). (B) SO and SWA power were significantly reduced in stim OFF compared to sham OFF condition (SO: P = 0.03, SWA: P = 0.04).
