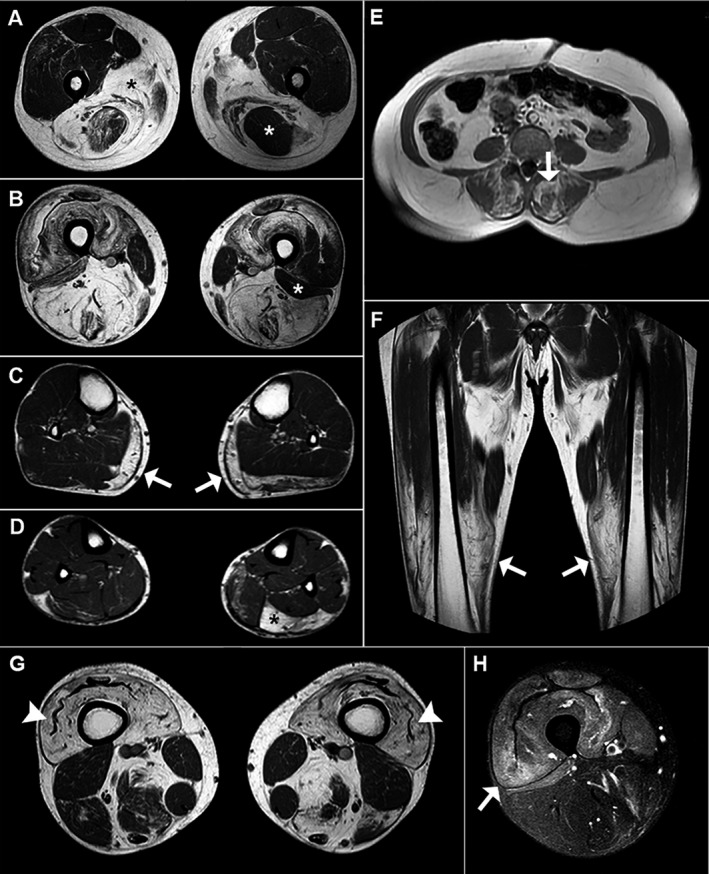
Figure 3.

Typical MRI findings of ANO5‐related myopathy. (A and B) Axial T1‐weighted images of the thighs reveal striking involvement of the posterior compartment (mainly the semimembranosus and the adductors) in patient #7; black asterisks in A show bilateral fatty degeneration of the adductors, and the white asterisk in A shows asymmetrical involvement of the semitendinosus. White asterisks in B show asymmetrical sparing of the short head of the left biceps femoris. (C and D) Axial T1‐weighted images of the legs show bilateral fatty infiltration of the medial head of the gastrocnemius (white arrows in C) and asymmetrical involvement of the soleus (black asterisk in D) in patient #7. (E) Axial T1‐weighted image of the lumbar spine of patient #9 reveals severe fatty degeneration of the posterior paravertebral muscles (white arrow). (F) Coronal T1‐weighted image of the thighs in patient #15 shows a craniocaudal gradient of involvement (the distal portion of the quadriceps muscles is more affected than the proximal portion). (G and H) Axial T1‐weighted image of the thighs of patient #29.1 shows severe fatty infiltration of the quadriceps and the “undulating fascia” sign (white arrowhead) in G, and areas of hyperintensity indicate muscle edema (white head) in H (axial STIR‐weighted image)
