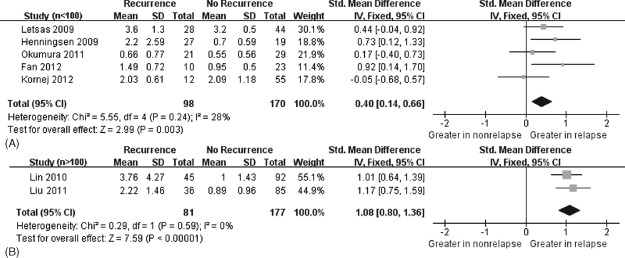
Figure 3.

Forest plot of atrial fibrillation recurrence risk associated with increased baseline C‐reactive protein levels under the sample size (n < 100 vs n > 100). Fixed‐effects model and IV method were used. (A) The results by sample size n < 100. (B) The results by sample size n > 100. The squares and horizontal line represent the study‐specific standardized mean difference (SMD) and 95% confidence interval (CI). The diamond represents the pooled results of SMD and 95% CI.
