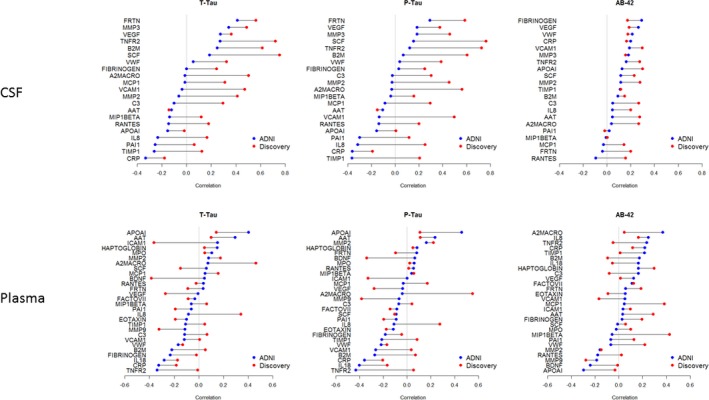
Figure 2.

Cluster plot noting similar correlation ordering among the inflammatory analytes in ADNI and discovery cohorts, with shared ordering of analytes more notable in CSF than plasma measures.(Colored points: Pearson correlation coefficients of discovery and ADNI analytes, Connector lines: difference in correlation values for each analyte compared between the two datasets).
