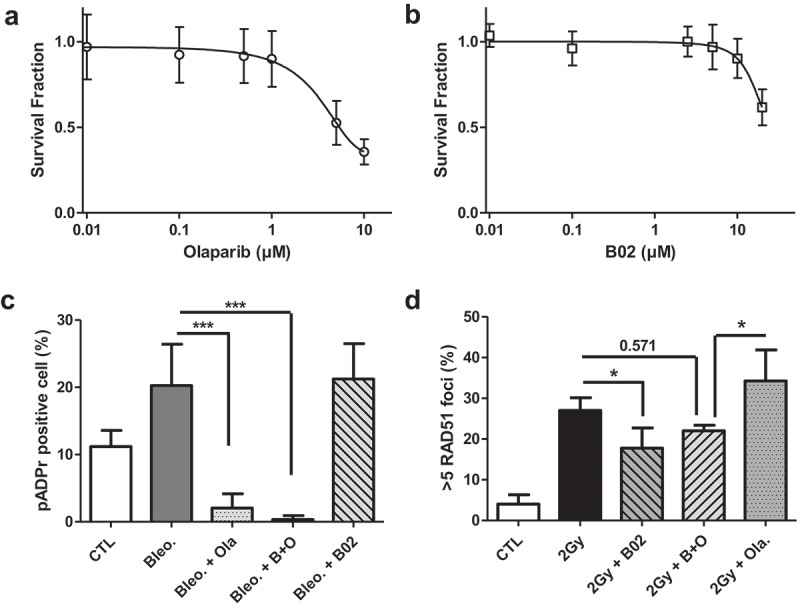
Figure 1.

Inhibitor cytotoxicity and efficiency. (a-b) A549 cells were exposed to increasing concentrations of Olaparib and B02 during 24 h. The survival fraction was determined using clonogenic assays 12 days after treatment. (a) Survival fraction obtained after exposure to Olaparib; (b) Survival fraction obtained after exposure to B02. Three independent experiments were performed, and data are presented as mean ± 1 SD. The data have been adjusted to a sigmoidal dose–response curve using GraphPad Prism. (c-d) Inhibitor efficiency at the chosen concentration: 3 h before exposure, A549 cells were incubated in the presence or absence of 0.5 µM Olaparib (Ola.), 10 µM B02 (B02) or the two inhibitors (B+O). (c) After a 2 h exposure to 1 µM bleomycin, A549 cells were labeled for pADPr and the proportion of pADPr positive cells determined; (d) 3 h after 2 Gy X-ray irradiation, A549 cells were labeled for RAD51 and cells with more than 5 RAD51 foci scored. Three independent experiments were performed, and data are presented as mean ± 1 SD. Mann-Whitney statistical analyses were performed (p > 0.05: ns; p < 0.05: *; p < 0.01: **; p < 0.001: ***).
