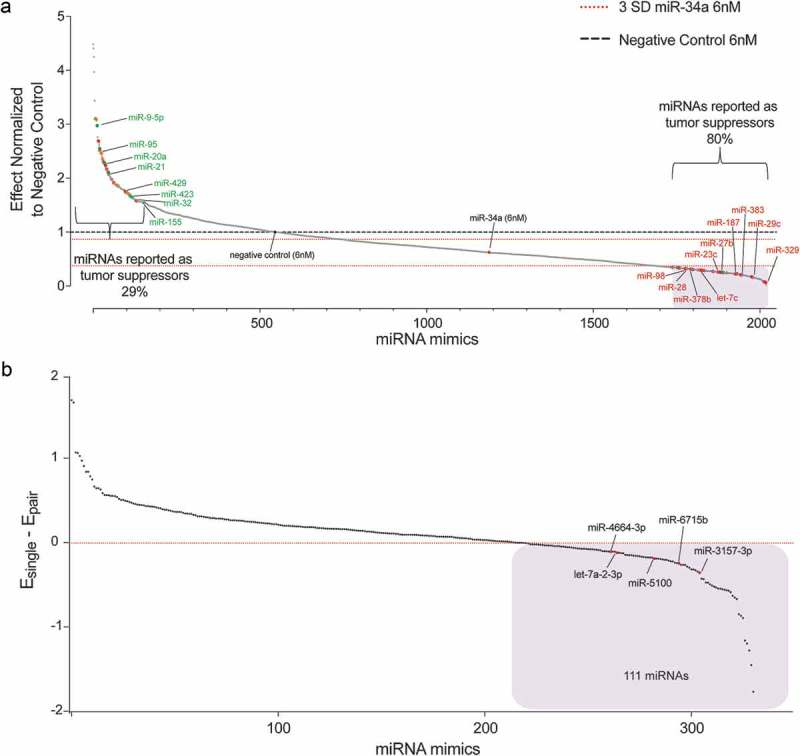
Figure 2.

miRNAs alter miR-34a antiproliferative potential. (a) miRNA mimics ranked according to effect, normalized to negative control (NC) transfected cells. Red dashed line = 3 s.d. of the effect of miR-34a alone. Black dashed line = effect of NC treated cells. Blue shaded box = 333 miRNA mimics that were moved forward in B. n = 6. Each dot represents the mean effect of a miRNA combination. (b) Validation of 333 miRNA mimics represented as the effect of the individual miRNA (Esingle) minus the effect when combined with miR-34a (Epair). Values <0 indicate that the combination has a better antiproliferative activity than the miRNA by itself. n = 6. Each dot represents the mean effect of a miRNA combination. Blue shaded box = 111 miRNA mimics with apparent combinatorial activity. The five miRNAs subsequently determined to have synergistic activity with miR-34a are indicated.
