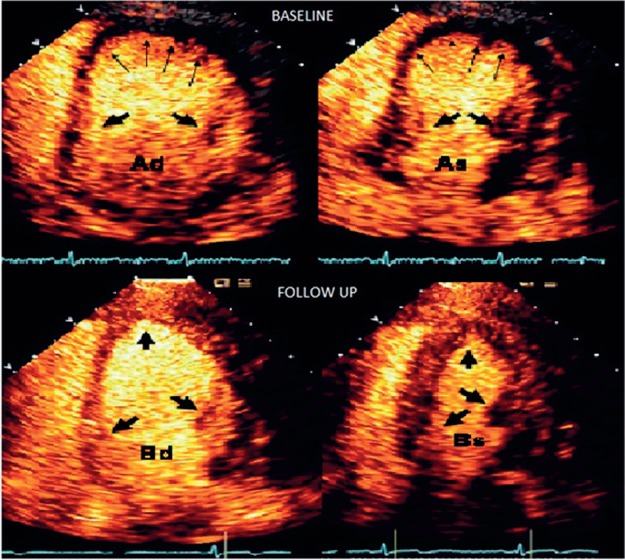
Figure 2.

Perfusion echocardiogram at admission (A) and 6‐month follow‐up (B) in diastole (d) and systole (s). Panel Ad reveals thinning and lack of contrast uptake in the apex (thin arrows) with good uptake at the base (fat arrows). Panel As shows good thickening of the basal segments with ballooning of apex (thin arrows). Panel Bd and Bs show normal perfusion and wall motion on follow‐up.
