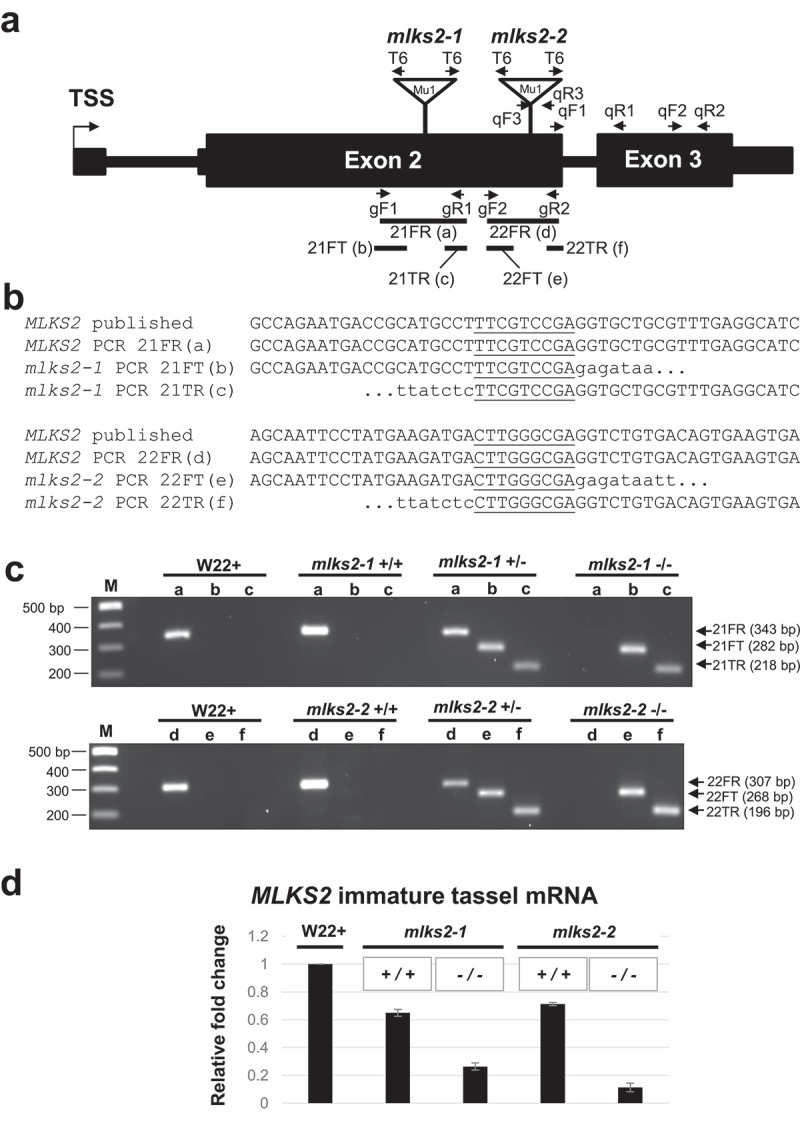
Figure 3.

Genotypic characterization of MLKS2 alleles. Two transposon-tagged alleles of MLKS2, mlks2-1 and mlks2-2 are depicted. a) MLKS2 gene model showing the location of Mu1 transposon insertion sites (triangles) for two alleles. The positions of allele-specific primer pairs (gF1, gR1 and gF2, gR2) and Tir6 primer (T6) at the Mu1 transposon terminal inverted repeat sequence are marked with arrows. The positions of primer pairs (qF1, qR1; qF2, qR2; or qF3, qR3) used for qRT-PCR are also marked with arrows. The PCR products (21FR, 21FT, 21TR, 22FR, 22FT, and 22TF) used for sequence verification, genotyping, and quantitative RT-PCR are indicated below the gene model. b) Sequences aligned around the insertion site include the published parental sequence [82], the wild-type allele from PCR products (‘a’ and ‘d’) from W22, and the mutator-flanking sequences from PCR products (‘b’,”c”, ‘e’, and ‘f’) using one gene primer and one mutator-specific primer (T6). In both alleles, a 9-bp duplication (underlined) was detected. c) Agarose gels showing PCR products amplified from W22 and plants from families segregating for mlks2-1 (top gel) or mlks2-2 (bottom gel) allele. The PCR products were amplified using gene-specific primer pairs (lanes/PCR products a, d) or primer pairs from one gene-specific primer and one mutator (T6) primer (lanes/PCR products b, c, e, f). Plant genotypes are shown on the top of the gels, primer pairs and band sizes are indicated on the right. The lanes ‘M’ contain 100 bp DNA marker fragments at the lengths indicated. d) Fold change in the transcript levels of MLKS2 in families segregating for mlks2-1 or mlks2-2; homozygous WT siblings (+/+) or homozygous mutant plants (-/-) were quantified relative to W22 using an average of 3 primer pairs (qF1-qR1, qF2-qR2, qF3-qR3) as measured by qRT-PCR.
