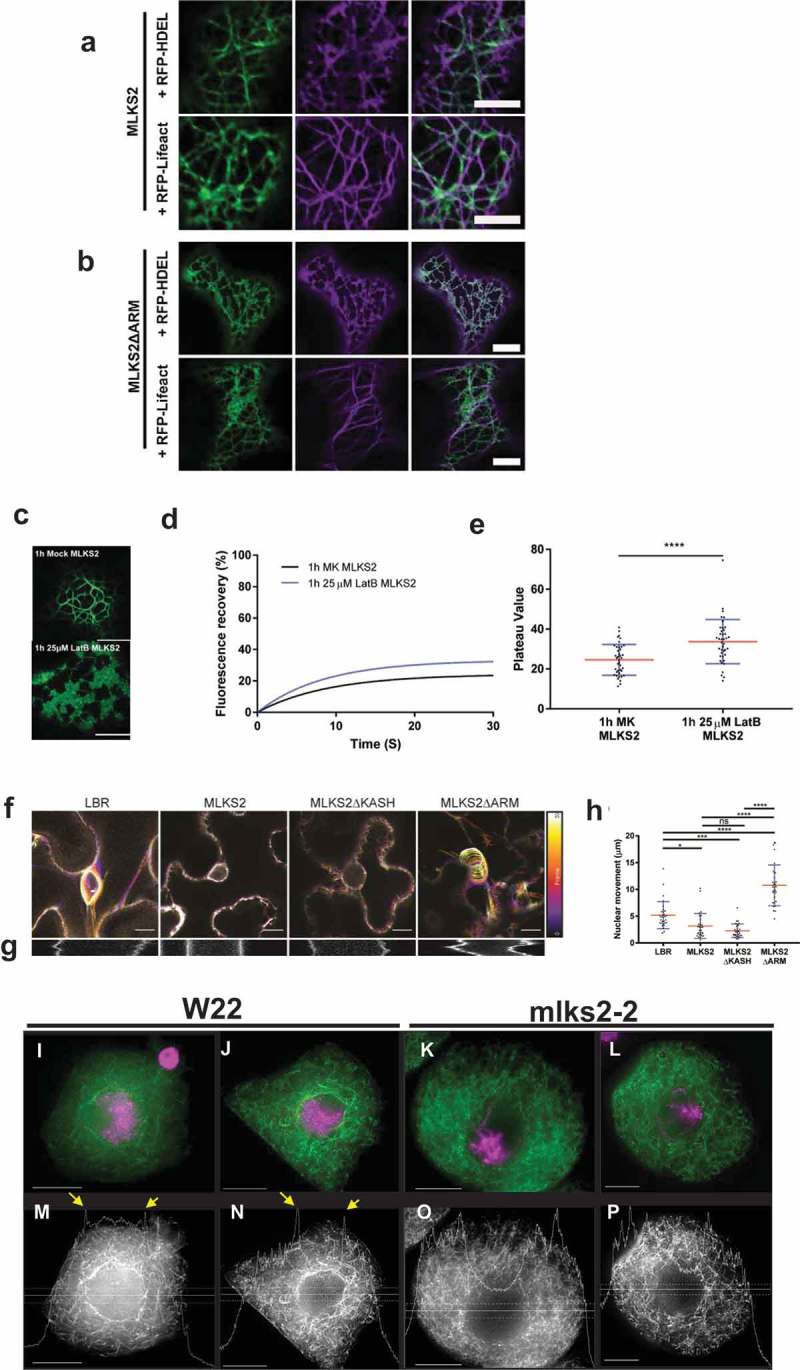
Figure 7.

MLKS2 interaction with actin.
Co-localization of ER marker (RFP-HDEL, magenta) or actin marker (RFP-LifeAct, magenta) with a) GFP-MLKS2 or b) GFP-MLKS2ΔARM. c) GFP-MLKS2 localization in F-actin-depleted cells (25 uM LatB) phenocopies GFP-MLKS2ΔARM with an ER-like staining pattern. d) Depolymerization of the actin cytoskeleton with LatB results in increased GFP-MLKS2 FRAP recovery compared to mock (MK) controls. e) FRAP Plateau value of MLKS2 mock (MK) and LatB treated as shown in d). For whisker plots, blue lines denote SD error bars, red lines denote mean. Student’s T-test used to test statistical significance. **** = P ≤ 0.0001. Scale bar denotes 10 µm. f) Temporal color-coded projections of randomly selected LBR, MLKS2, MLKS2ΔKASH and MLKS2ΔARM nuclei imaged every 10 seconds over 5 minutes. g) Kymographs of nuclear movement shown in f) for a different nucleus. h) Quantification of total nuclear movement over time, imaged for LBR, MLKS2, MLKS2ΔKASH and MLKS2ΔARM. N = at least 30 nuclei imaged across three experimental repeats per treatment; ANOVA statistical test used. Ns = P ≥ 0.05, * = P ≤ 0.05, *** = P ≤ 0.001 and **** = P ≤ 0.0001. (i-l) DAPI (magenta) and phalloidin (green) stained early prophase maize meiocytes. (m-p) Gray-scale images of phalloidin staining of cells shown in panels i-l. Line trace plots show intensity of phalloidin in the middle of the cell marked by horizontal band, illustrating the spike in perinuclear actin in wild-type but not mutant nuclei. Scale bar denotes 15 µm.
