
Figure 3. Emi1 Is Required for Rapid and Irreversible APCCdh1 Inactivation.
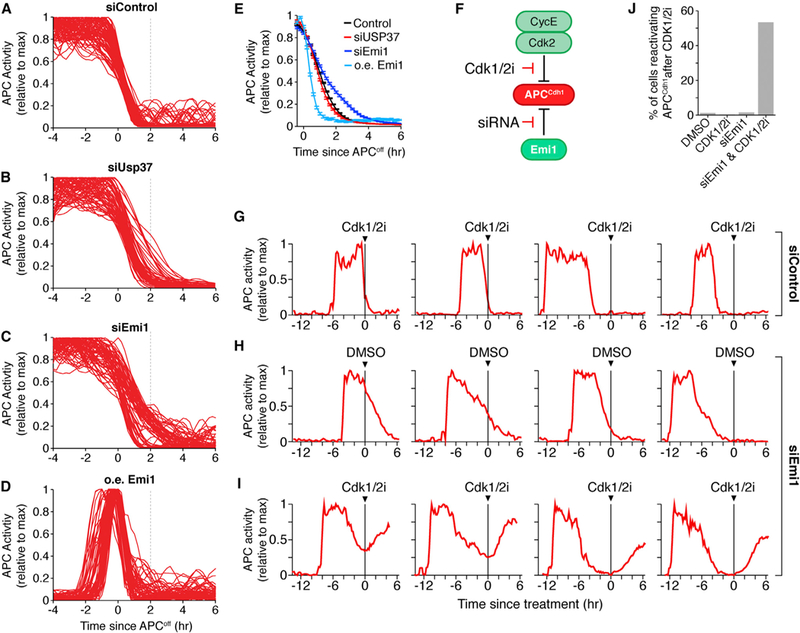
(A-D) Single-cell APC activity traces aligned to the time that APCCdh1 starts to turn off in cells treated with either control (A), Usp37 (B), or Emi1 siRNA (C) or cells overexpressing (oe) wild-type Emi1 (D). Dashed line added for reference between panels.
(E) Median APC activity trace ± SEM from cells in (A-D). n = 276, 201, 214, 152, respectively.
(F) Schematic of experimental design for (G-I).
(G-I) Single-cell APC activity traces treated with either control (G) or Emi1 siRNA (H and I). Cells were exposed to either DMSO (H) or Cdk1/2 inhibitor (G and I) at the indicated time. Data from all cells is in Figure S3J.
(J) Bar graph of the percent of cells that reactivate APCCdh1 upon Cdk1/2 inhibitor addition. n≈ 250 cells per condition. See also Figure S3.