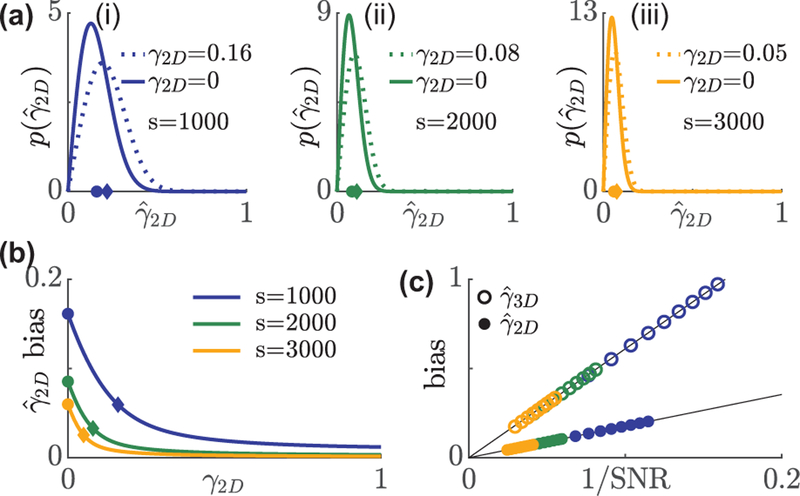
FIG. 1.
Distribution and bias of rotational constraint measurements using in-plane excitation polarization modulation. (a) A non-central chi PDF describes the distribution of under s = (i) 1000, (ii) 2000, and (iii) 3000 signal photons with 1†b = 7290 background photons per 526.5 × 526.5 nm2 (3.5× FWHM of a diffraction-limited spot) region. Solid line: isotropic emitters, dashed line: emitter whose bias is smaller by 1/e compared to an isotropic emitter. Circles and diamonds on the x axis represent the mean of the aforementioned two distributions, respectively. (b) Average bias in versus the ground truth γ2D. Blue, green, and orange represent 1000, 2000, and 3000 signal photons, respectively. Circles and diamonds correspond to the same data points in (a). (c) Bias in the measured rotational constraint of isotropic emitters scales linearly with the inverse of SNR, . Solid circles: , open circles:.

