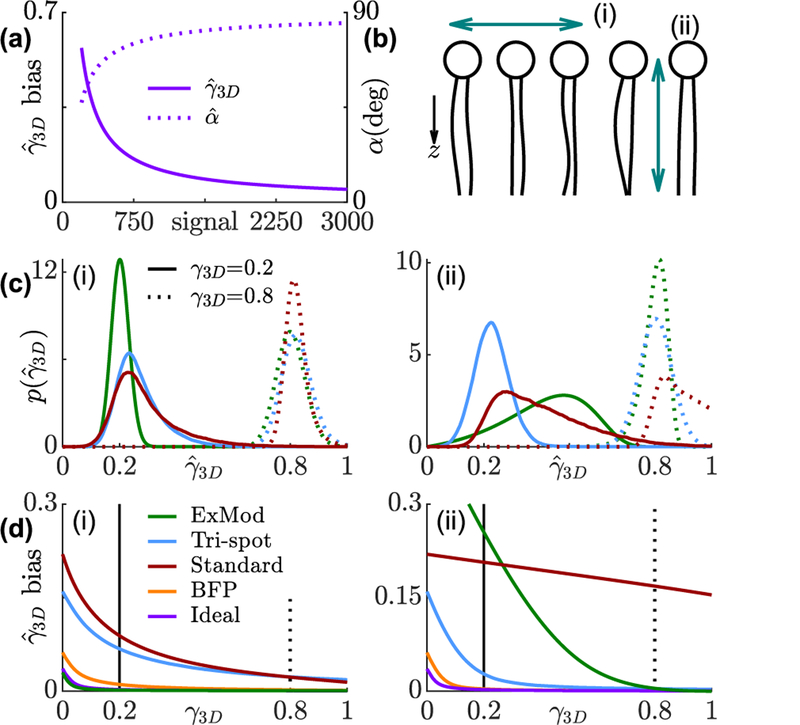
FIG. 3.
Bias and precision of rotational constraint measurements using various techniques. (a) Minimum detectable rotational constraint for various numbers of signal photons and 4860 total background photons. Solid line represents the expectation of measured rotational constraint for isotropic emitters; dashed line represents the corresponding cone half-angle if the molecule is symmetrically diffusing in a cone. (b) Concept of (i) a horizontally- and (ii) a vertically-orientated fluorescent molecule within a lipid membrane. (c) Distribution of 3D rotational constraint estimates . Solid line: true rotational constraint γ3D = 0.2 (cone half-angle α = 72°); dashed line: γ3D = 0.8 (α = 31°). (d) Bias of for each technique. Green: in-plane excitation modulation, blue: Tri-spot PSF, red: standard PSF, orange: back focal plane imaging, purple: ideal basis-image matrix.

