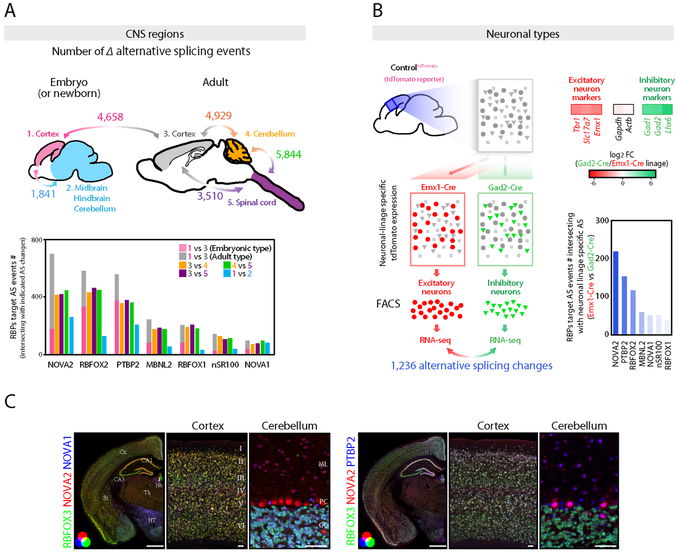
Figure 1. Diversity of alternative splicing and RNA binding proteins expression within the CNS regions and neuronal types.
(A) AS diversity across the CNS regions and during cortical development. Upper panel shows the schematics illustrating the summary of AS changes determined by RNA-seq data across the mouse CNS regions and during mouse cortical development. The number indicates the significantly changed cassette-type AS event number (FDR<0.05, ∣ΔI∣>=0.1) between two tissues indicated by bidirectional arrows. Lower graph shows the AS event numbers intersecting with the AS events changing in each RBP-KO mouse brain (FDR<0.05, ∣ΔI∣>=0.1). (B) AS diversity between neuronal-types. Schematics illustrating the strategy for AS analysis between two distinct neuronal types prepared from e18.5 cortex of tdTomato reporter mouse which expresses tdTomato in Cre dependent fashion (Left panel). 1,236 AS events were significantly changed between two neuronal types (FDR<0.05, ∣ΔI∣>=0.1). Heatmaps show the excitatory or inhibitory neuron markers enrichment determined by RNA-seq (Upper right). AS event numbers intersecting with AS events changing in each RBP-KO mouse brain (FDR<0.05, ∣ΔI∣>=0.1) (Lower right). (C) RBPs expression diversity within the CNS regions and neuronal types. NOVA2, NOVA1 and RBFOX3 or PTBP2 immunofluorescence staining images in 4 weeks old mouse brain sections. Scale bars: left: 1 mm, middle and right: 50 μm. “See also Figure S1 and Table S1.”

