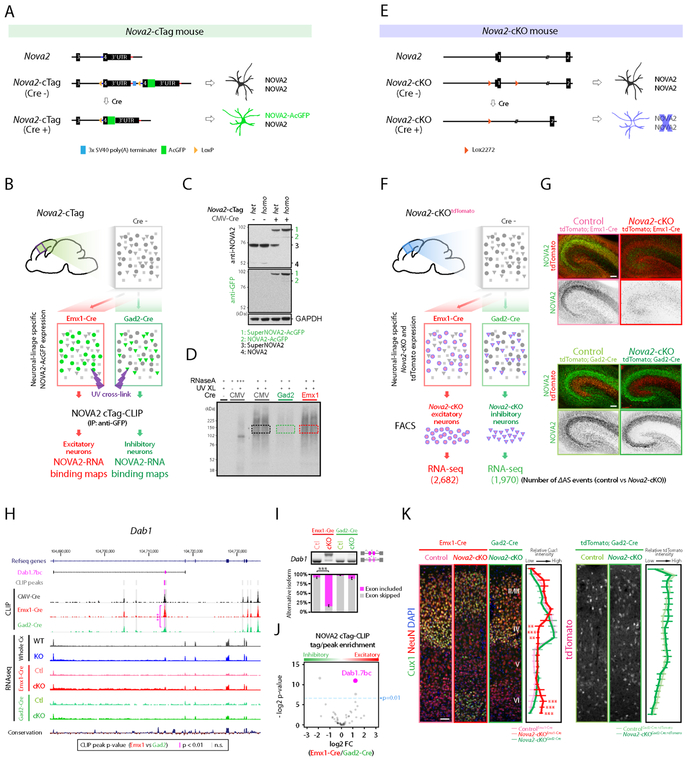
Figure 2. Generation of Nova2-cTag and Nova2-cKO mouse models discovering neuronal linage selective NOVA2 AS targets.
(A) Schematics illustrating simplified Nova2-cTag mouse model providing selective AcGFP-tagged NOVA2 expression in specified neuronal-type in vivo. (B) Schematics illustrating the strategy for selective NOVA2 cTag-CLIP in the targeted neuronal type in vivo. (C) Cre-dependent NOVA2-AcGFP protein expression. Indicated mouse brain lysate were subjected to immunoblot analysis with anti-NOVA2 or anti-GFP antibody. SuperNOVA2 is a different NOVA2 isoform translated from the same gene (Saito et al., 2016). (D) Autoradiograph image of neuronal linage specific NOVA2 cTag-CLIP. Colored box regions were subjected to CLIP library cloning steps. (E) Schematics illustrating the Nova2-cKO model providing NOVA2 depletion from selective neuronal type in vivo. (F) Schematics illustrating the strategy for AS analysis in specific neuronal type (FDR<0.05, ∣ΔI∣>=0.1, n=3). (G) NOVA2 depletion from selective neuronal populations. NOVA2 (green) and tdTomato (red) immunofluorescent staining images in the e18.5 hippocampus of indicated 4 mouse lines. Scale bars: 100 μm. (H) UCSC genome browser view of NOVA2-regulated Dab1.7bc AS difference in the different neuronal cell-type. Significantly different CLIP peak between neuron-types was highlighted with magenta shadow. ***; p<0.001. (I) RT-PCR confirmation of Dab1.7bc AS changes detected by RNA-seq (n=3). ***; p<0.001. (J) NOVA2 cTag-CLIP peak enrichment normalized to RNA abundance and functional NOVA2 protein abundance. Each dot indicates an individual NOVA2 CLIP peak on Dab1 transcript; 3 of 53 peaks were significantly different between inhibitory (Gad2-cre) and excitatory (Emx1-Cre) neurons (p<0.01, Fisher’s exact test). (K) Cortical excitatory neuron specific migration defect in Nova2-cKO mice. 3 weeks old indicated mouse lines were subjected to immunostaining. Cux1: layer II-IV marker. Quantification of Cux1 (left) and tdTomato immunointensity (right) (n >= 4, **; p<0.01, ***; p < 0.001). Scale bars: 50 μm. “See also Figure S2 and Table S1.”

