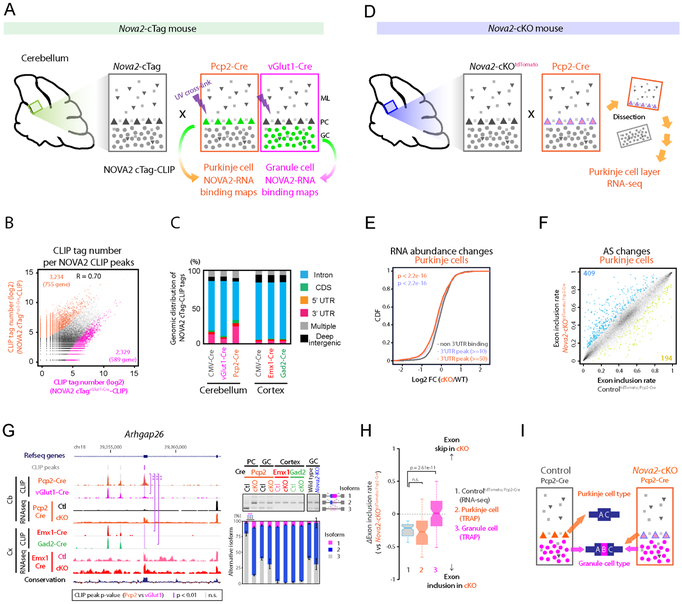
Figure 3. NOVA2 characterizes Purkinje-type exon skip.
(A) Schematics illustrating the overview for neuronal type specific NOVA2 cTag-CLIP in cerebellum. (B) The comparison of neuronal-type specific NOVA2 cTag-CLIP between Purkinje cells (PCs) and granule cells (GCs). Scatter plot shows the correlation of read counts on CLIP peaks between NOVA2 cTagPcp2-Cre-CLIP to NOVA2 cTagvGlut1-Cre-CLIP. Each black dot represents a comparable CLIP peak between two neuronal-type. Each orange or magenta dot represents a significantly enriched CLIP peak in either NOVA2 cTagPcp2-Cre-CLIP or cTagvGlut1-Cre-CLIP, respectively (FDR<0.05, ∣log2 FC∣>=1). R: correlation coefficient. (C) Genomic distribution of NOVA2 and NOVA2 cTag-CLIP unique tags. (D) Schematics illustrating the strategy for AS analysis in PCs. (E) Transcript abundance changes upon NOVA2 depletion from PCs determined by RNA-seq. The empirical cumulative distribution function of NOVA2 targets binned by NOVA2 cTagPcp2-Cre-CLIP peak tags. (F) AS changes depending on NOVA2 depletion from PCs. Scatter plot shows the exon inclusion rate of the 4 weeks old ControltdTomato; Pcp2-Cre and Nova2-cKOtdTomato; Pcp2-Cre determined by RNA-seq. Each black dot represents a comparative AS event. Each blue or limegreen dot indicates the significantly changed AS event which skipped in Nova2-cKOtdTomato; Pcp2-Cre (409 AS events) or included in Nova2-cKOtdTomato; Pcp2-Cre (194 AS events), respectively (n=3, FDR<0.05, (∣ΔI∣>=0.1). (G) Discovery of a PC-selective NOVA2 mediated AS event. UCSC genome browser view of around Arhgap26 AS exon 21 (NM_175164) (left). A significantly different NOVA2 CLIP peak among neuron-types was highlighted with purple shadow; peaks that were unchanged across all cell types are underscored with grey dotted shadow. RT-PCR confirmation of AS change detected by RNA-seq (right panels) (n=3). **; p<0.01, ***; p<0.001. (H & I) GCs-type exon inclusion in PCs of Nova2-cKO. ΔI of 1; ControltdTomato; Pcp2-Cre PCs layer (RNA-seq), 2; wild-type PCs (TRAP) or 3; wild-type GCs (TRAP; Mellén et al., 2012) versus Nova2-cKOtdTomato; Pcp2-Cre PCs layer (RNA-seq) (H). Schematics illustrating the AS patterns switch from inhibitory PCs-type to excitatory GCs-type in Nova2-cKOtdTomato; Pcp2-Cre PCs (I). “See also Figure S3 and Table S1.”

