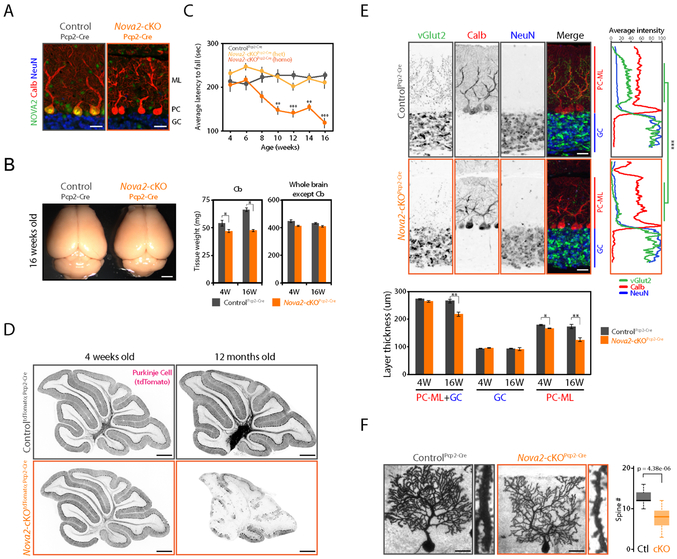
Figure 4. Purkinje cell specific Nova2 deficiency leads progressive motor discoordination and cerebellar atrophy.
(A) Selective NOVA2 depletion from PCs. NOVA2 (green), calbindin D28 (calb, red: PCs marker), and NeuN (blue: GCs marker) immunofluorescent staining images in the 4 weeks old cerebellum of ControlPcp2-Cre and Nova2-cKOPcp2-Cre. Scale bars: 25 μm. (B) Progressive cerebellar atrophy in the PCs specific Nova2-cKO mouse. Brain images of 16 weeks old ControlPcp2-Cre and Nova2-cKOPcp2-Cre mouse (left). Tissue weight of cerebellum and the other brain regions in 4 weeks old (4W) or 16 weeks old (16W) ControlPcp2-Cre and Nova2-cKOPcp2-Cre mouse (right) (n=3, *; p<0.05). Scale bars: 2 mm. (C) Progressive motor coordination defect in the PCs specific Nova2-cKO mouse. Rotarod test result at indicated age (weeks) (n>=5, **; p<0.01, ***; p<0.001). (D) PCs-degradation in the 12 months old PCs specific Nova2-cKO mouse. tdTomato immunostaining images with anti-mRFP antibody. Scale bars: 500 μm. (E) The climbing fiber innervation defect and reduced PCs molecular layer thickness upon PCs specific Nova2 deficiency. vGlut2 (green, climbing fiber terminal marker), calbindin D28 (red, PCs marker), and NeuN (blue, GCs marker) immunofluorescent staining images in the 16 weeks old ControlPcp2-Cre and Nova2-cKOPcp2-Cre mouse (upper left). Quantification analysis of vGlut2, calbindin D28, and NeuN fluorescent (n=3, ***; p<0.001) (upper right). Quantification analysis of GC and PC-ML layer thickness in 4W or 16W ControlPcp2-Cre and Nova2-cKOPcp2-Cre mouse (lower panel) (n=3, *; p<0.05, **; p<0.01). PC-ML: Purkinje cell and molecular layer. GC: granule cell layer. Scale bars: 25 μm. (F) Reduced PCs spine number upon the NOVA2 depletion. Golgi staining images of 16 weeks old ControlPcp2-Cre and Nova2-cKOPcp2-Cre mouse (left). Quantification of spine numbers per 10 nm dendrite length (neurons number >=14 from three biological replicates) (right). Scale bars: 25 μm. “See also Figure S4 and Movie S1.”

