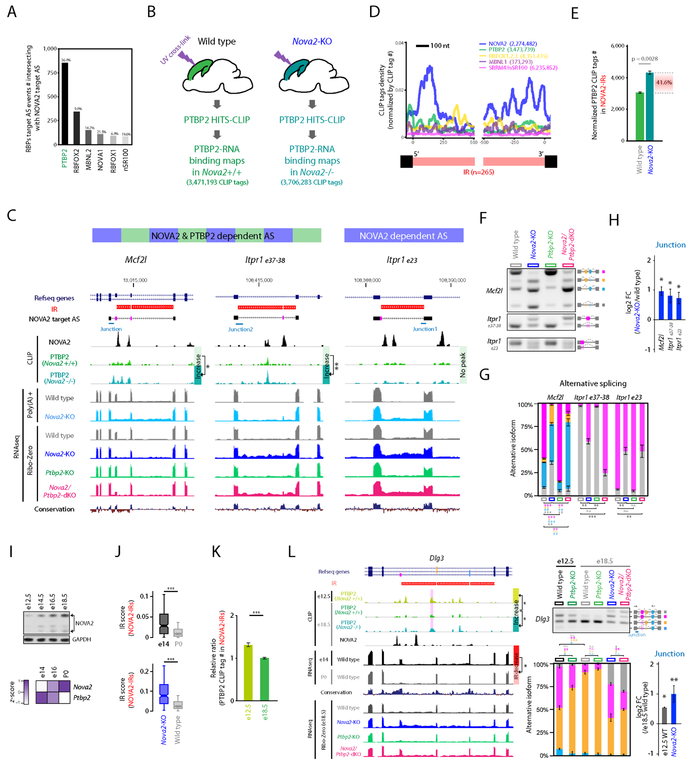
Figure 5. NOVA2 prevents IR which serves as a cis-acting scaffold element for AS factor PTBP2.
(A) Intersection of NOVA2 and PTBP2 target AS events. The number of RBPs target AS events intersecting with NOVA2 target AS events. (B) Schematics illustrating the overview for PTBP2 CLIP in the presence or absence of NOVA2 in vivo. (C) UCSC genome browser views of examples for PTBP2 CLIP peak changes coupling with IR and AS changes. Magenta shadow represents a NOVA2 and/or PTBP2 target AS exon. PTBP2 CLIP height scale were fixed in same scale between wild type and Nova2-KO. (D) NOVA2 CLIP tags enriched in both 5’ and 3’end of retained introns. (E) IR recruits trans-acting AS regulator PTBP2. PTBP2 CLIP tag number counted on NOVA2-regulated IR (NOVA2-IRs) which were normalized to total PTBP2 CLIP tag number of each replicate (n=3). (F & G) AS difference in Nova2/Ptbp2-dKO which have IR and increased PTBP2 CLIP peak. (H) IR retains exon-intron junction. qPCR quantification of RNA retaining exon-intron junction (n=3, ; p<0.05). (I) NOVA2 expression increases during cortical development at the protein (upper panels: Western blot) and RNA (lower panel: RNAseq) levels; (J and K) those changes in NOVA2 levels in (I) are inversely related to a decrease of NOVA2-regulated IR (NOVA2-IRs) (J) and PTBP2 binding (K) to those NOVA2-IRs (normalized to both total CLIP tag number and abundance of transcript ***: p<0.001). (L) Cortical developmental stage specific PTBP2 target AS coupling to the degree of NOVA2 regulated IR. UCSC genome browser view of Dlg3 transcript (left: significantly different CLIP peak was highlighted with magenta shadow). Quantification of AS (RT-PCR) and exon-junction (qPCR) of Dlg3 transcript (right). N=3, *; p < 0.05, **; p < 0.01, ***: p < 0.001. “See also Figure S5 and Table S1.”

