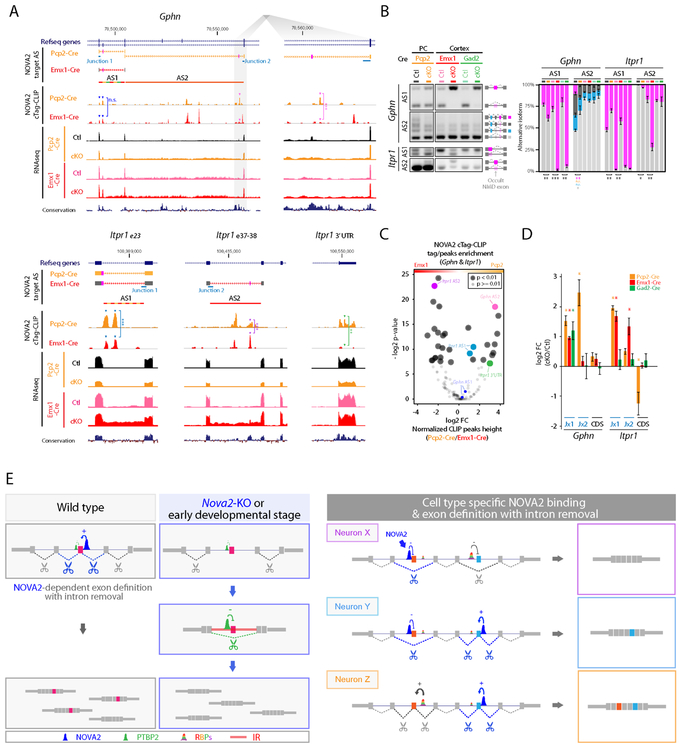
Figure 6. NOVA2 prevents neuronal cell-type specific IR and diversify AS regulation.
(A) Neuronal subtype selective and NOVA2-dependent AS changes coupling with IR and NOVA2 cTag-CLIP peak enrichment. UCSC genome browser views of examples (Gphn and Itpr1). **; p<0.01, ***; p<0.001. (B) Quantification of AS difference by RT-PCR (n=3, *; p<0.05, **; p<0.01, ***; p<0.001). (C) NOVA2 cTag-CLIP peak enrichment normalized to RNA abundance and functional NOVA2 protein abundance. Each dot indicates an individual NOVA2 CLIP peak on either the Gphn or Itpr1 transcript (as for Figure 3I; p<0.01, Fisher’s exact test). (D) Cell type selective IR retains exon-intron junction. Quantification of transcripts or it retaining exon-intron junction by qPCR (n=3, *; p<0.05). Orange; Purkinje cells, red; cortical excitatory neurons, green; cortical inhibitory neurons. (E) Model Schematics for neuronal subtype specific AS and its regulatory mechanism. NOVA2 regulates exon definition and IR, which serves as a platform for trans-acting AS regulators (left). NOVA2 cTag-CLIP revealed different NOVA2 binding positions on the same transcripts in different neuronal cell-types in which NOVA2 regulates cell-type specific AS and promotes cell-type specific intron removal (right). This cell-type specific IR removal can alter other RBPs binding to intron and exon definition. “See also Figure S6.”

