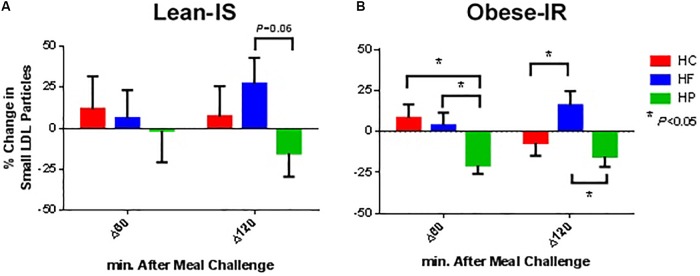
FIGURE 2.
Percentage change from baseline for plasma small LDL particle concentration at 60 and 120 min following ingestion of three different isocaloric mixed meals. High-protein (green), high-fat (blue), or high-carbohydrate (red) liquid mixed meals in panel (A) nine lean insulin-sensitive and (B) nine obese insulin-resistant subjects. Values are means ± SEM.

