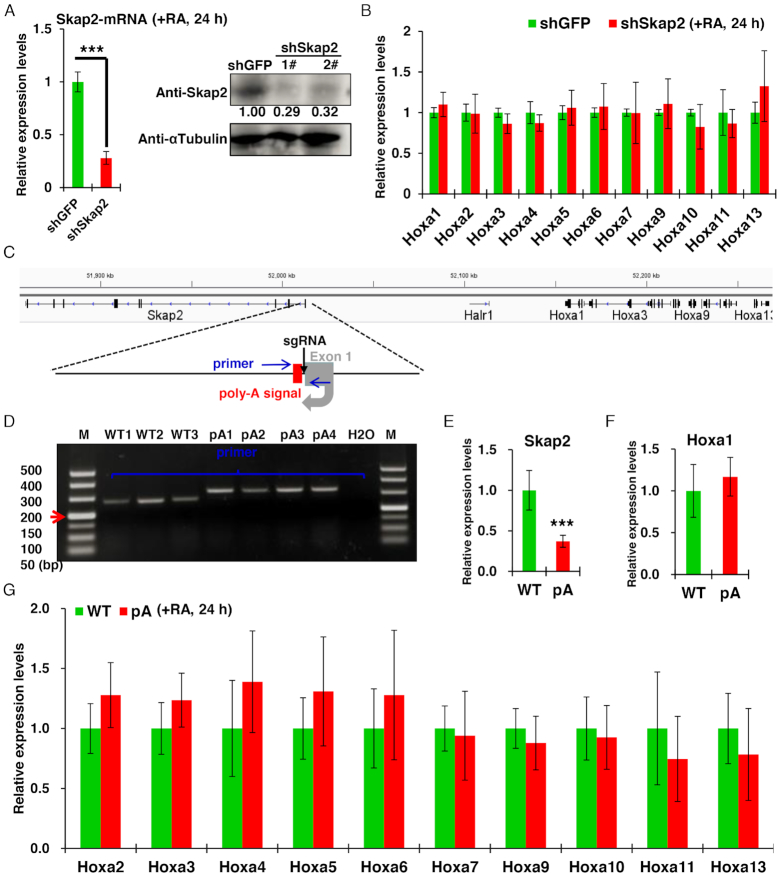
Figure 3.
The expression and transcription of Skap2 are not required for Hoxa1 expression. (A) Skap2 mRNA and protein levels were significantly inhibited following Skap2 shRNA relative to shGFP control treatment. While Hoxa1 and Hoxa2–a13 expression levels were unchanged (B). (C) Schematic showing CRISPR/Cas9-mediated insertion of a 49-bp synthetic poly-A signal (red box) downstream of the Skap2 TSS. Primers used for genotyping and Sanger sequencing are shown in blue arrows. (D) Genotyping based on gDNA PCR of DNA isolated from indicated WT or poly-A knock-in (pA) cell lines. (E–G) qRT-PCR of WT and poly-A knock-in (pA) cells showing expression of Skap2 (E), Hoxa1 (F) and Hoxa2–a13 genes (E) in ESCs after RA treatment. Data are represented as mean values ± s.d. Indicated significance is based on Student's t-test (*P < 0.05, **P < 0.01, ***P < 0.001). In (A and B), n = 3 or 6, including one shRNA for GFP knockdown, two shRNAs for Skap2 knockdown and three technical replicates per cell line. In (E–G), n = 9 or 12, including three WT, four Skap2-pA cell lines and three technical replicates per cell line. Image J software was used to quantitative relative protein levels in (A). M: DNA Marker.

