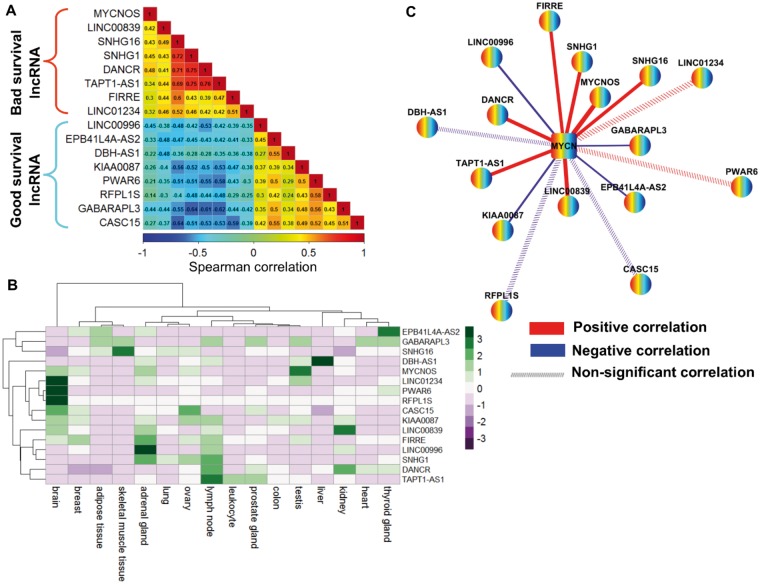
Figure 7.
Spearman correlation coefficient (SCC) analysis of the 16–long noncoding RNA (lncRNA) signature from the discovery cohort. A) SCC matrix shows correlations within bad survival lncRNAs and good survival lncRNAs. The color scale bar denotes correlation strength, with 1 indicating a positive correlation (red) and –1 indicating a negative correlation (blue). B) Heat map shows the fragments per kilobase of transcript per million mapped reads (FPKM) normalized expression value of 16 lncRNAs across 16 normal human tissues from the Illumina Body Map project. The expression value of each lncRNA was z-normalized and is shown with a green-purple color scale. C) The co-expression network of 16 lncRNAs and MYCN in MYCN-amplified neuroblastoma. Nodes represent lncRNA and MYCN coding gene, whereas edges represent the SCC of expression profiles between lncRNAs and the MYCN coding gene. Red edges represent positive correlations, and blue edges represent negative correlations. Edge width is proportional to the strength of the correlation. Dashed edges indicate that the correlation between lncRNA and the MYCN coding gene is nonsignificant. FPKM = fragments per kilobase of transcript per million mapped reads; lncRNA = long noncoding RNA; SCC = spearman correlation coefficient.

