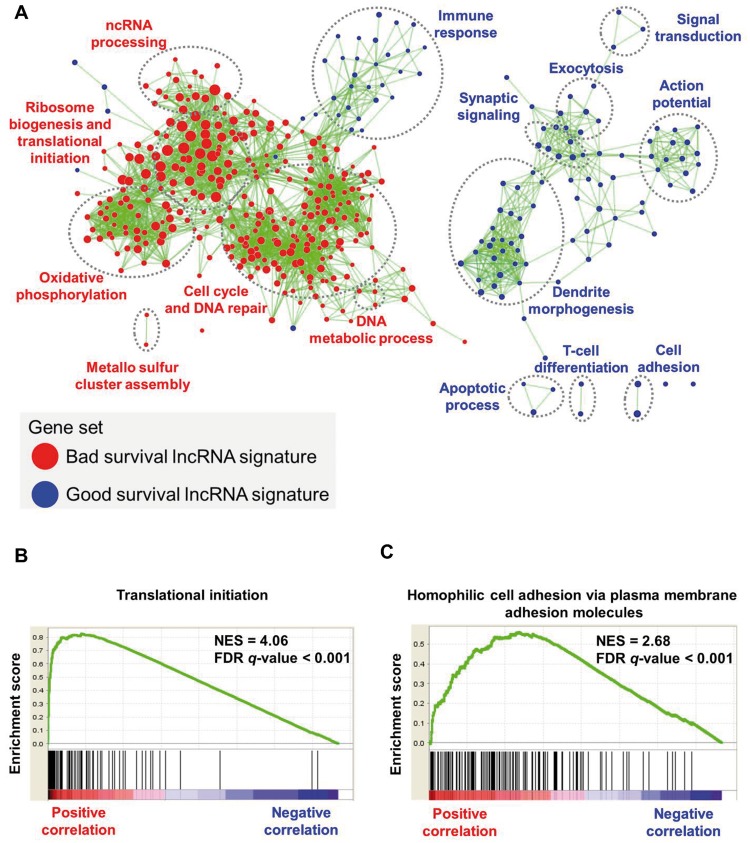
Figure 8.
Gene set enrichment analysis of the 16–long noncoding RNA (lncRNA) signature in neuroblastoma patients. A) Network shows overrepresented gene sets for the lncRNA signature. Red nodes represent bad survival lncRNA signature gene sets, and blue nodes represent good survival lncRNA signature gene sets. Node size is proportional to the normalized enrichment score. Biologically related gene sets tend to form clusters; these were manually identified and labeled with appropriate gene ontology terms. The network was generated using an enrichment map-cytoscape plug-in. B and C) Enrichment plot shows highest enriched function for the bad survival lncRNA (DANCR) and the good survival lncRNA (CASC15). FDR = false discovery rate; lncRNA = long noncoding RNA; NES = normalized enrichment score.

