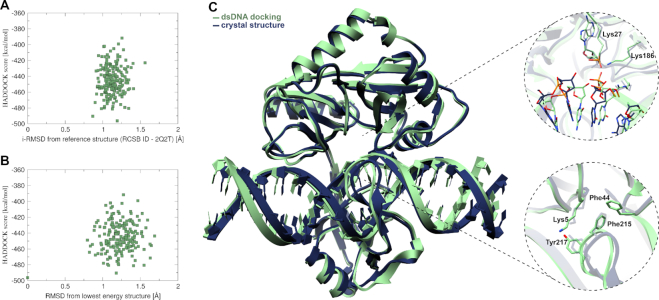
Figure 3.
(A) HADDOCK score vs iRMSD from crystal structure (PDB ID: 2q2t). (B) HADDOCK score versus RMSD from lowest energy structure. For detailed statistics on top HADDOCK clusters for bound and unbound docking see Supplementary information S5.4C) Superimposition of the simulated docked complex (green) with the crystal structure (dark blue) together with close-ups. Upper close-up shows the spatial conservation of the nick, lower close-up shows the conserved stacking (Phe44-Phe215) and hydrogen bond (Lys5-Tyr217) interaction (Supplementary information S4).

