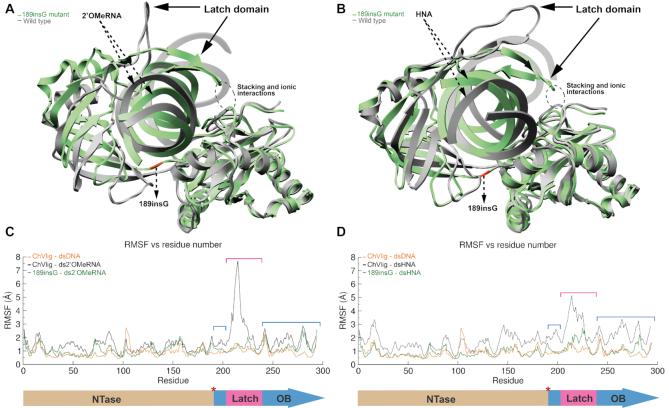
Figure 5.
Plot (A) (2’OMeRNA) and plot (B) (HNA) showing the overlay between the ‘open’ WT-dsXNA (gray) and closed 189insG–dsXNA complexes (green with orange insert). Position of the latch domain is indicated by an arrow. The evolutionary conserved clamp-closing in green complexes is highlighted in a dashed circle. RMSF plots in panel (C) (2’OMeRNA) and panel (D) (HNA), different domains are depicted below the graph. Red asterisk indicates the insert position.

