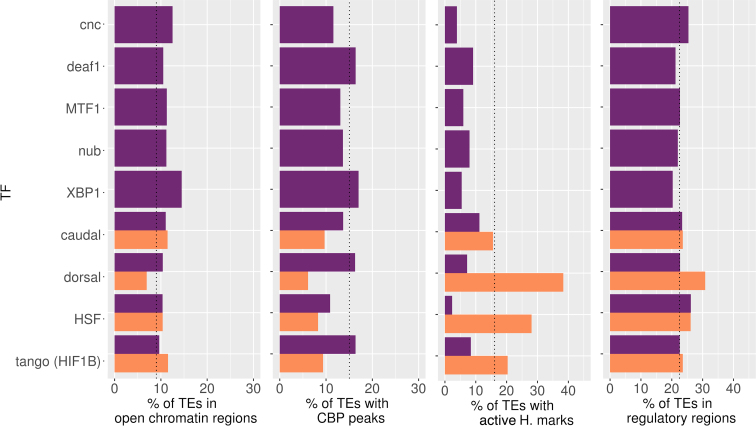
Figure 4.
Enhancer/promoter genomic characteristics in TEs with predicted TFBMs/TFBSs in D. melanogaster. Percentage of TEs with at least one TFBMs/TFBSs for each one of the nine transcription factors studied overlapping with (A) open chromatin regions, (B) containing a CBP peak, (C) enriched for active histone marks or (D) located in a regulatory region. In purple, merged dataset of TFBMs/TFBSs and in orange dataset with evidence from ChIP-seq. The vertical dotted line showed the expected percentage for each feature.

