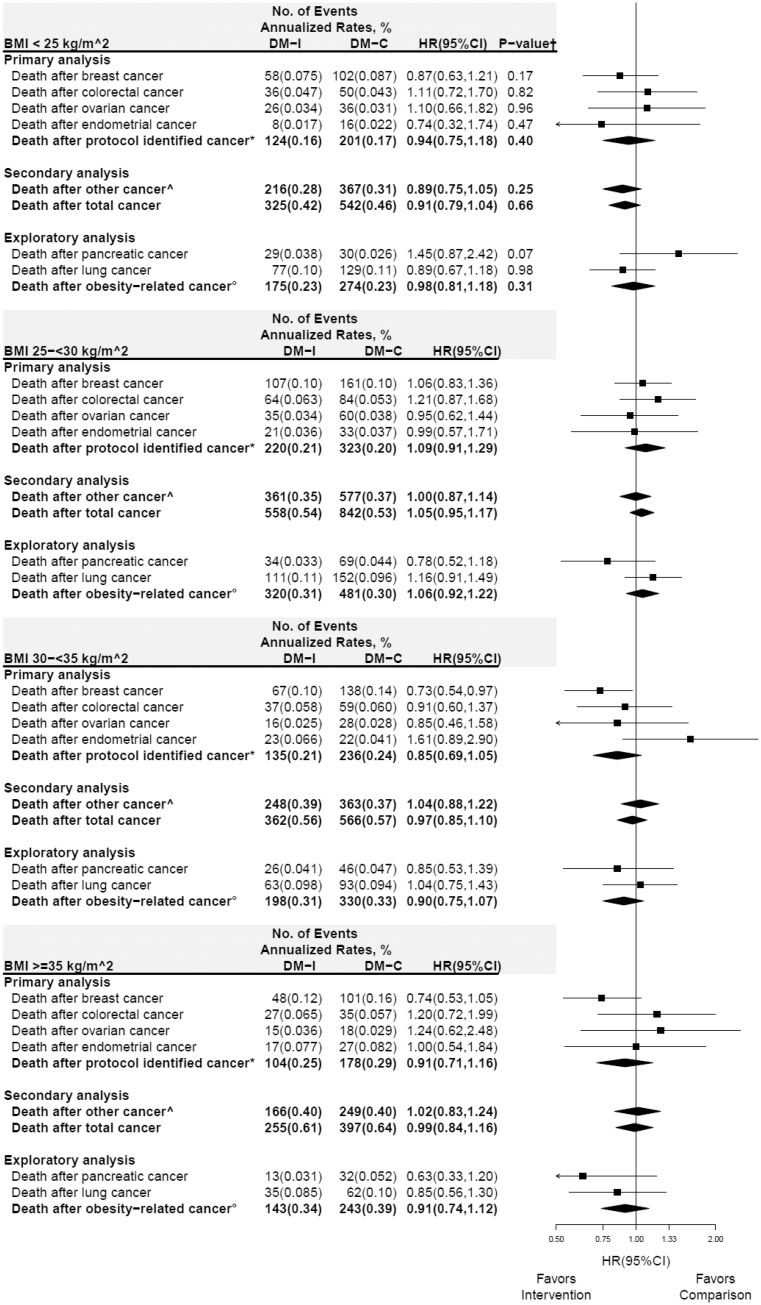
Figure 3.
Subgroup analysis of deaths from any cause after cancer for cumulative follow-up (intervention period + postintervention periods) according to baseline body mass index (BMI) group. Forest plot and summary statistics of the dietary modification influence on deaths among normal (BMI < 25 kg/m2; top panel), overweight (25–<30 kg/m2), obese (30–<35 kg/m2), and very obese women (≥35 kg/m2; bottom panel). P value corresponds to a 1 degree-of-freedom test for trend of the interaction between BMI group and randomization group. See above for definition of: *protocol identified cancer; ^other cancer; and °deaths from any cause after incident obesity-related cancer. HR = hazard ratio; CI = confidence interval.

