Figure 1.

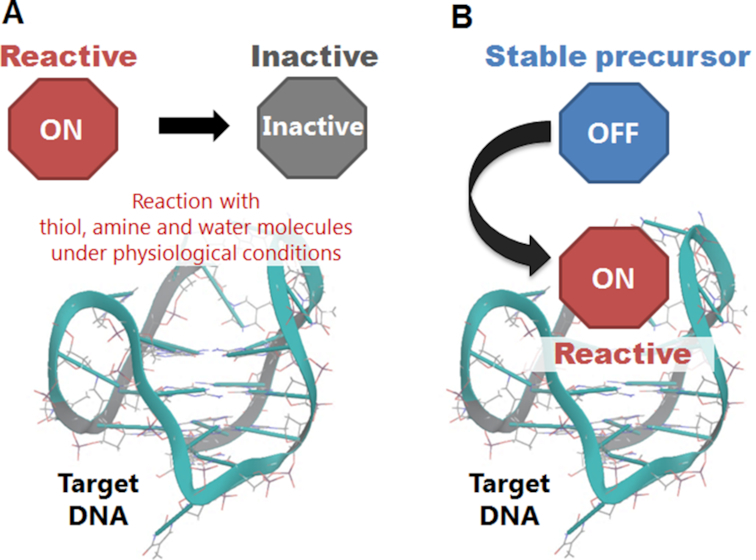
Schematic representation of the ligand inactivation under physiological conditions (A) and ligand-binding activation (B).

Schematic representation of the ligand inactivation under physiological conditions (A) and ligand-binding activation (B).