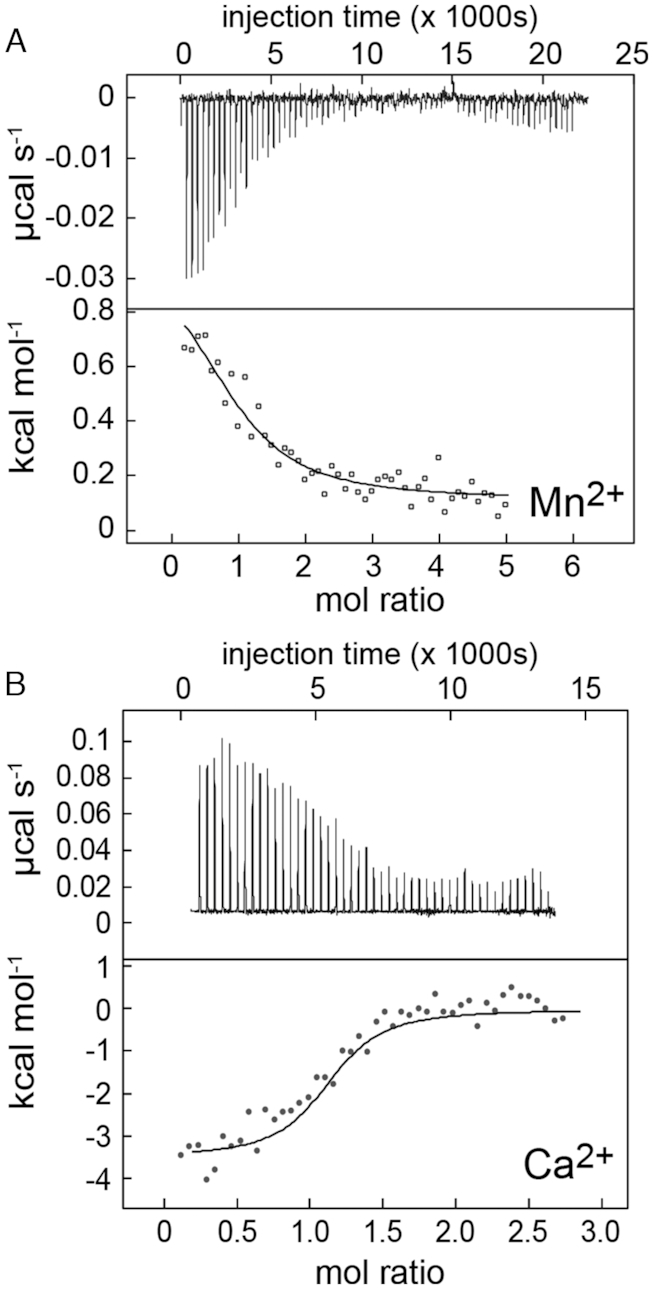
Figure 6.

Thermograms of the interaction of the mgtA aptamer with Mn2+ (A) or Ca2+ (B) by isothermal titration calorimetry. For each panel, the upper panel shows the raw ITC data plotted as the change in power (μcal s−1) required to maintain equal temperature between the sample and reference cells as the function of time; lower panel shows intergated heat normalized for mol of injectant added. The thermodynamic parameters for metal binding defined by the continuous lines drawn through the data are summarized in Table 1.
