Figure 2.
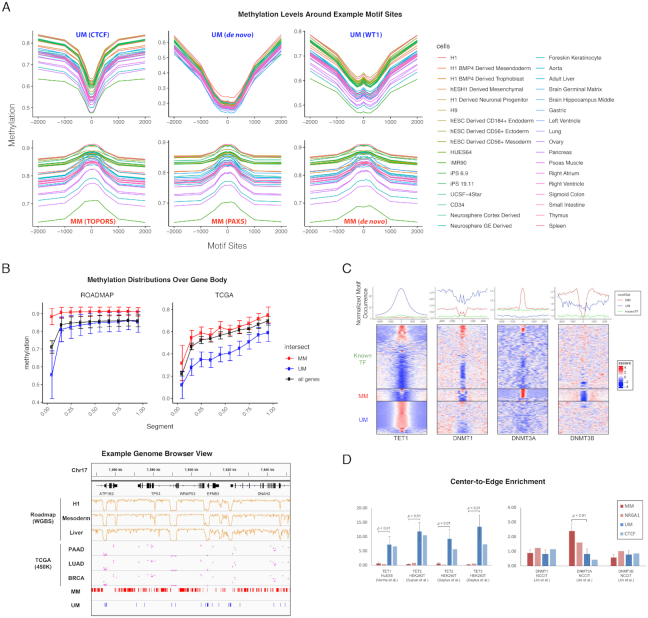
Identified motifs mark methylation level. (A) Example motifs are shown with average CpG methylation level calculated in 50 bp bins around all motif sites, determined by FIMO at 10–5P-value cutoff. The examples are chosen from MM, UM, de novo motifs, matched known TFs, common region and sorted variable regions. Upper panel, from left to right: UM_180.0_3.14 (matched to CTCF); UM_106.1_4.08 (de novo); UM_238.2_3.88 (matched to WT1); lower panel, from left to right: MM_65.9_2.90 (matched to TOPORS); MM_814.4_2.02 (matched to PAX5); MM_206.3_2.16 (de novo). (B) DNA methylation levels in the ROADMAP (left) and TCGA (right) data sets over the gene body. Each gene body was split into ten equal bins and the Beta values of all CpGs in the same bin were averaged over all genes. Lower panel shows the correlation between the motif occurrences and CpG methylation in ROADMAP (WGBS data from H1, mesoderm, and liver) and TCGA (450K methylation of CpGs averaged in patients from PAAD, LUAD, and BRCA) around TP53 (chr17:7 540 000–7 650 000). (C) Normalized motif occurrence of UM, MM and known TFs (excluding matched) from HOCOMOCO (17) at 5000 bp windows centering ChIP-seq peaks of TET1, DNMT3A and DNMT3B collected from various studies (22,24,25). The lower panel shows the clustered heatmap of normalized z-score. (D). Center-to-edge enrichment of UMs and MMs in comparison with TF NR6A1 and CTCF, which were reported to recruit DNMT and TET to specific loci, at the ChIP-seq peaks of DNMTs and TETs.

