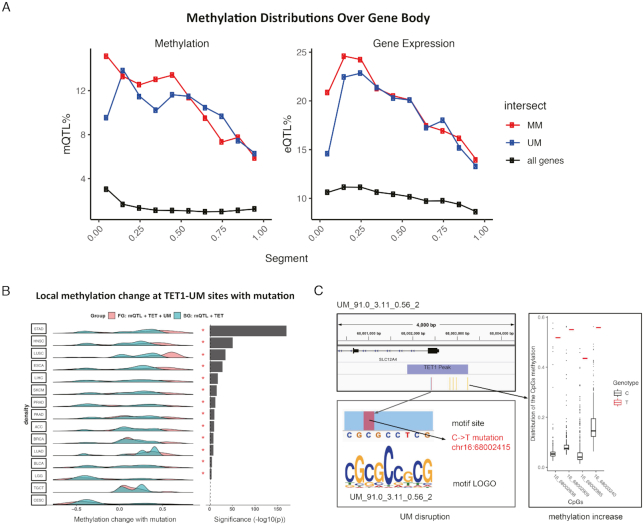
Figure 3.
Somatic mutation at motif sites co-occur with local methylation alteration. (A) Distribution of somatic quantitative trait loci corresponding to methylation (mQTL) and gene expression (eQTL) over gene body (see details in Materials and Methods). Each gene body is split into ten equal bins. (B) Methylation level change of CpG sites nearby TET1-UM sites (TET1 binding peaks containing UM motifs) overlapping with somatic mutations. Asterisks indicate P < 0.01 calculated with paired one-tail t-test, pairing foreground observed methylation change to the corresponding background expected methylation change. Foreground (FG), somatic mQTL at TET1-UM sites. Background (BG), somatic mQTL at TET1 binding peaks (22,24,25). To ensure the statistical significance, we only considered the 15 cancers with >100 CpGs within 5000 bp of TET1-UM sites (see details in Methods). (C) An example showing disruption of a UM motif (no match with known motifs) by a C→T somatic mutation at chr16:68002415 significantly increases the methylation level of the four nearby CpGs in the LUAD patients.

